List of figures

Source: Eurostat

Source: Eurostat

Source: Eurostat

Source: Green Street Pan-European commercial price index

Refinitiv

Source: Bloomberg

Source: Refinitiv

Source: Refinitiv

Source: EBA supervisory reporting data

Source: EBA supervisory reporting data

Source: EBA supervisory reporting data

Source: EBA Supervisory Reporting data

Source: EBA Supervisory Reporting data

Source: EBA Supervisory Reporting data

Source: EBA Supervisory Reporting data


Source: US International Trade data commission

Source: EBA supervisory reporting data

Source: EBA supervisory reporting data

Source: EBA Supervisory Reporting data

Source: EBA Supervisory Reporting data

Source: EBA supervisory reporting data (funding plan data)

Source: EBA supervisory reporting data (funding plan data)

Source: EBA supervisory reporting data (funding plan data)

Source: EBA supervisory reporting data (funding plan data)

Source: EBA Supervisory Reporting data

Source: EBA supervisory reporting data

Source: EBA Supervisory Reporting data

Source: EBA Supervisory Reporting data

Source: EBA Risk Assessment Questionnaire

Source: EBA supervisory reporting data

Source: IHS Markit*

Source: Dealogic

Source: Dealogic

Source: MREL/TLAC reporting

Source: MREL/TLAC reporting

Source: EBA supervisory reporting data (funding plan data)

Source: EBA supervisory reporting data (funding plan data)

Source: EBA supervisory reporting data (funding plan data)

Source: EBA supervisory reporting data (funding plan data)

Source: EBA supervisory reporting data (funding plan data)

Source: EBA supervisory reporting data (funding plan data)

Source: EBA supervisory reporting data

Source: EBA supervisory reporting data

Source: EBA supervisory reporting data

Source: EBA supervisory reporting data

Source: EBA Supervisory Reporting data

Source: EBA Supervisory Reporting data

Source: EBA Supervisory Reporting data

Source: EBA Supervisory Reporting data

Source: EBA Supervisory Reporting data (Funding Plan data)

Source: EBA Supervisory Reporting data (Funding Plan data)

Source: EBA supervisory reporting data

Source: EBA supervisory reporting data

Source: EBA supervisory reporting data

Source: S&P Global

Source: EBA supervisory reporting data

Source: EBA Supervisory Reporting data

Source: EBA supervisory reporting data

Source: EBA Supervisory Reporting data

Source: EBA Supervisory Reporting data

Source: EBA Risk Assessment Questionnaire

Source: EBA Supervisory Reporting data

Source: EBA Supervisory Reporting data

Source: EBA Risk Assessment Questionnaire

Source: EBA Supervisory Reporting data

Source: EBA Risk Assessment Questionnaire

Source: EBA supervisory reporting data

Source: S&P Capital IQ, and EBA assumptions and calculations

Source: EBA Risk Assessment Questionnaire
Figure 67: Financial crime risks, April 2024–March 2025


Source: ECB, EBA Supervisory Reporting data

Source: EBA Supervisory Reporting data

Source: ECB and EBA calculations
Figure 72b: EU/EEA banks’ cumulative excess reserves* and p.p. change between June 2022 and December 2024
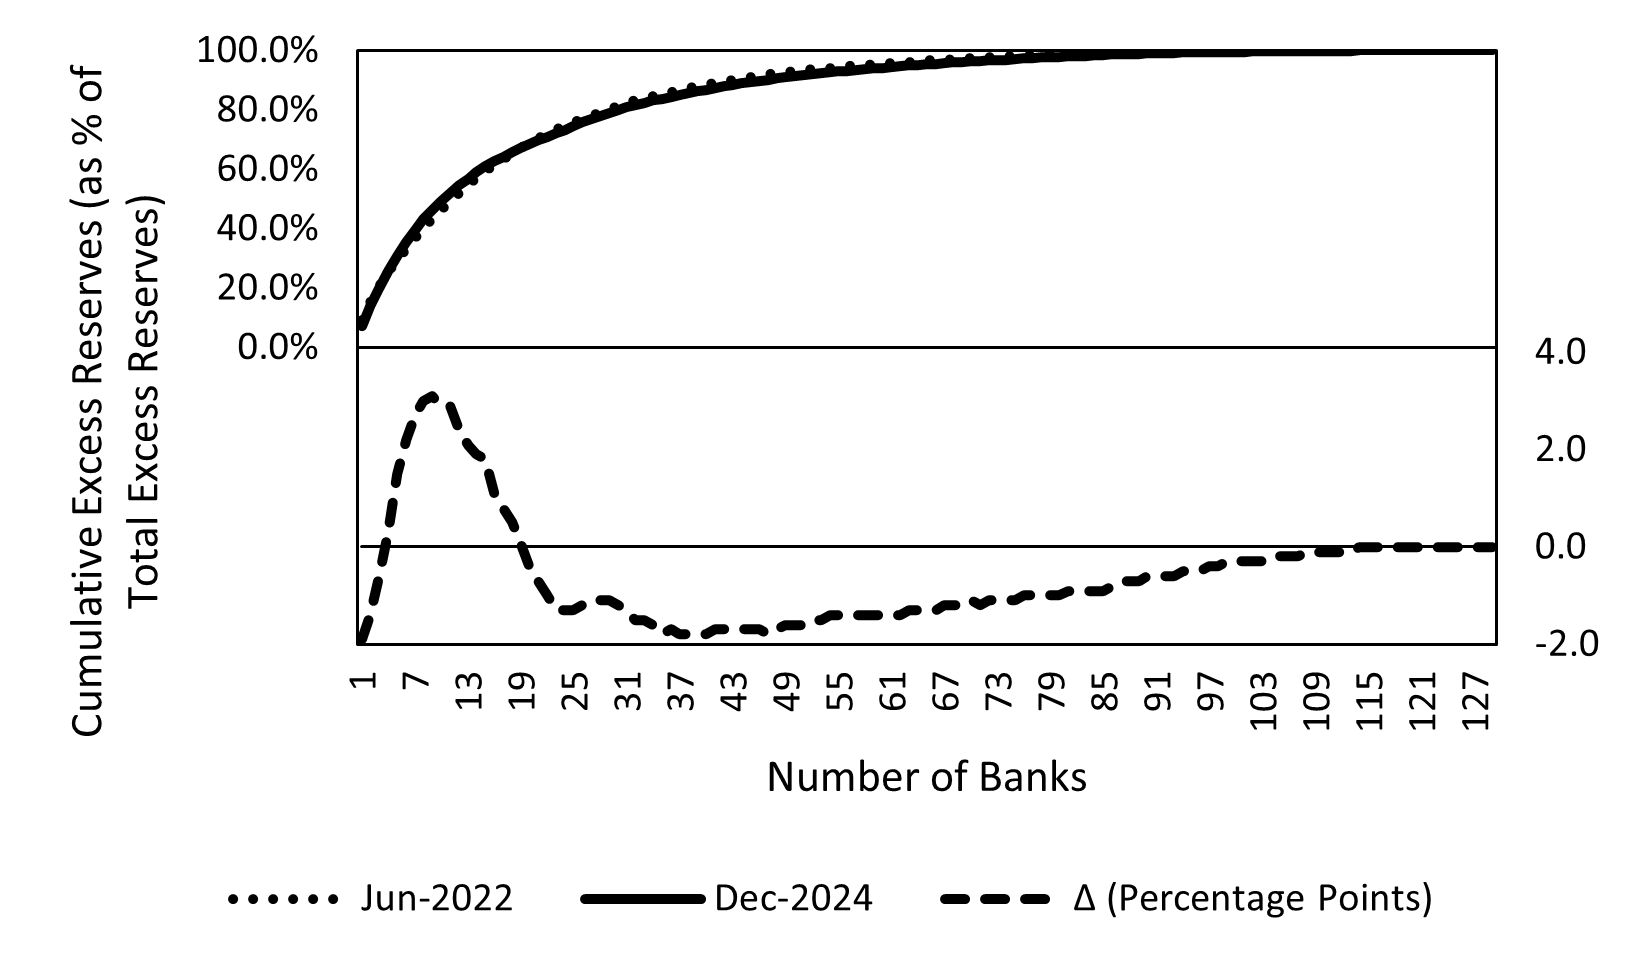

Source: EBA supervisory reporting data

Source: EBA supervisory reporting data