This Risk Assessment Report (RAR) was prepared by the Economic and Risk Analysis Department[1]. The report has benefited from input and comments from other Departments across the European Banking Authority (EBA), as well as from members of the EBA’s Supervision, Risks and Innovation Standing Committee (SUPRISC) and the EBA’s Board of Supervisors (BoS). Many thanks also to the editors of this version of the RAR. If you would like to provide comments on this report please write to rast@eba.europa.eu.
Executive summary
EU/EEA banks remain resilient and, despite the more volatile and fragile risk environment, are expanding their balance sheets further. Lending to households and non-financial corporates (NFCs) rose by 2.7% in 2025. Exposures to non-bank financial institutions (NBFIs) increased significantly in 2025 – increasing their relevance (reaching around 10% of total assets) while remaining concentrated, particularly among systemic institutions. Private credit exposures for EU/EEA banks remain limited but are also somewhat concentrated in larger banks. There are limited direct exposures to the Middle East, but second-round effects of the Iran war could have material impacts on banks. Energy‑intensive sectors are the most immediate areas in which higher energy prices could have a negative impact. Banks’ exposures to these sectors are sizeable in aggregate and vary widely by country and sector.
Looking forward, banks are planning for a continued broad-based balance sheet expansion, despite the challenging geopolitical developments. Even though there is wide dispersion among countries, overall lending to NFCs is expected to increase strongly. Household lending is expected to grow at a slower rate than NFC exposures. Banks’ projections point to a shift towards cross-border lending as a key growth driver, outpacing domestic activity and primarily led by intra-EEA exposures. Growth is also foreseen in exposures to other financial corporations, indicating continued strengthening of linkages with NBFIs. The results of the EBA’s Risk Assessment Questionnaire (RAQ) show that some lending segments are projected to face a particular rise – in addition to mortgage, consumer and small and medium enterprise (SME) lending – such as project finance and asset finance.
Asset quality is holding up well, but risks are increasingly concentrated in specific segments. Non-performing loan (NPL) ratios remain low, and shares of Stage 2 loans have fallen, yet vulnerabilities remain visible in SMEs, consumer credit and commercial real estate (CRE), with evident dispersion across countries. While Q1 results suggest a tendency among some banks to increase impairment overlays amid heightened geopolitical uncertainty, part of the increase may also reflect seasonal effects.
Despite the heightened macroeconomic uncertainty EU/EEA banks project a gradual decline in the coming years in their already low aggregate NPL ratio. This applies similarly for the NPL ratios of household and NFC exposures, but shows wide dispersion across countries, including some countries that expect a significant rise in the NPL ratios of some segments. Concerns around CRE and SME exposures are already evident from banks’ perspective, while macroeconomic uncertainty warrants vigilance with regards to household exposures, too.
Climate risk management is progressing, but advancement still differs widely across banks. Most institutions have set quantitative targets and strengthened governance, risk management and disclosure. Indications are that EU/EEA banks are leading developments in this area globally.
Funding conditions are benign, but competition for stable funding is increasing. Deposits remain the main funding source. Preferred senior debt issuance is expected to remain a key pillar going forward, and covered bond issuance volumes are expected to rise significantly. However, financial markets remain sensitive to headlines, and repricing can occur quickly, also due to increased geopolitical tensions. Heightened market volatility may also impede banks’ funding plans. If spreads widen or investor demand softens, banks may need to even further strive for deposit growth beyond their already rather optimistic current plans, make use of liquid assets or slow balance sheet growth.
Liquidity and funding ratios are expected to decline slightly in 2026 but remain well above 100% and regulatory minimums. Foreign currency asset and liquidity positions are expected to remain broadly unchanged. Asset encumbrance has increased slightly and is shifting towards securities collateral.
Recent developments in highly capable (frontier) artificial intelligence (AI) large language models (LLMs), with vastly enhanced capabilities to discover and exploit software vulnerabilities, have raised wide-ranging concerns among banks and supervisors. These LLMs are, at the very least, further increasing cyber risk. Banks may be particularly vulnerable, especially if they lack, or are not in a position to acquire, the operational capacity to respond swiftly enough to such developments. This also reflects overall assessment of operational risk, which continues to rise, driven by cyber risk and data security as well as fraud. While data confirm that cyberattacks have not materially increased, geopolitical tensions have heightened cyber and data security-related risks as well as physical threats.
EU/EEA banks’ return on equity (RoE) is above 10% and banks expect this to slightly improve in 2027 and 2028. Net interest income (NII) remains a key component of EU/EEA banks’ revenues. However, the assumed increase in profitability is driven by an expected decline in staff and other administrative expenses. This could prove to be a rather optimistic assumption. Other administrative expenses include information and communication technology (ICT)-related costs, which might not necessarily retreat amid constant and potentially even increasing investment needs. Furthermore, interest rate risk remains very uneven across banks and can quickly materialise amid the uncertain rate environment, affecting NII and the economic value of equity (EVE). Results for the first quarter of 2026 demonstrate that EU/EEA banks’ profitability remains resilient. NII, supported by bottoming out net interest margins (NIMs) and stable loan growth, and broadly stable fee income continued to underpin banks’ profitability.
Banks are planning for a further increase in their payouts, which comes at a time when risk-weighted assets (RWA), credit impairments and market volatility could shift faster than expected. Capital ratios of EU/EEA banks are near record highs, and headroom above overall capital requirement (OCR) and Pillar 2 Guidance (P2G) has remained stable close to 500bps over the past 12 months. Yet dispersion across banks and countries remains wide. Q1 results showed some pressure on capital ratios, driven by an upward tick in RWA. In addition to the downside credit risks due to macroeconomic uncertainty, larger sovereign holdings make capital positions more exposed to potential repricing.
1. Macroeconomic environment and market sentiment
Energy shocks and volatile commodity prices reshape the economic outlook
The seizure of oil and gas flows through the Strait of Hormuz has generated one of the largest global shocks in the supply of energy for several years, forcing prices to reach levels not seen since the Russian attack on Ukraine. Brent crude oil prices surged strongly, while Title Transfer Facility (TTF) gas prices almost doubled (Figure 1). The International Monetary Fund (IMF) forecasts that energy prices will peak sharply in 2026, pushing both oil and gas costs significantly higher and feeding directly into inflation and reduced purchasing power[2]. Even under the IMF’s baseline assumptions, the shock is expected to negatively affect consumption and investment, while more adverse scenarios point to a risk of more severe outcomes, particularly if disruptions persist for longer. Despite the ceasefire agreement, with the conflict in the Middle East not being resolved and continuing to disrupt global oil and gas supply, the macroeconomic environment will remain highly uncertain and will particularly impact energy-intensive sectors (see Box 2 on how the Middle East crisis particularly affects energy-intensive sectors).

Source: Refinitiv
The economic situation affects inflation dynamics and growth expectations in the EU/EEA, which is now facing renewed upwards pressure on prices. For example, the euro area’s (EA) headline inflation is expected to rise from 2.1% in 2025 to 3.0%, while for the EU it will rise from 2.5% to 3.1% in 2026, largely driven by energy prices[3]. At the same time, higher energy costs are acting as a drag on real incomes and demand and contribute to a moderation in GDP growth expectations for 2026, which are now expected to slow to 0.9% for the EA and 1.1% for the EU. Monetary policy expectations have adjusted accordingly, and Euribor rates have moved upwards. Nonetheless, the outlook is subject to heightened uncertainty and remains heavily dependent on further developments in the Middle East.

Source: Eurostat

Source: Refinitiv
Increased economic uncertainty is weighing on consumption and investment decisions, while elevated energy costs are compressing household incomes and corporate margins, which are also affected by inflationary pressures and higher interest rates. Tightened financial conditions amplify downside risks for the economy. For the banking sector, this environment may translate into weaker credit demand and a deterioration in asset quality, particularly in energy-intensive sectors, while also creating new lending opportunities, possibly linked to investments in energy transition, infrastructure and defence (see Chapter 2 on the impact on banks’ assets).
Geopolitical shocks and elevated volatility weigh on market sentiment
European equities entered 2026 on a strong footing, with the Eurostoxx reaching its latest highs by late February – buoyed, for example, by falling interest rates, German fiscal stimulus and a rotation away from premium-valued US tech stocks – while the Eurostoxx Banks index (SX7E) reached its year-to-date (YtD) peak in early February, reflecting favourable earnings momentum and rate expectations. EA equities had previously outperformed their US counterparts, supported in part by a sharp rally in defence stocks amid rising geopolitical tensions. The outbreak of the Iran war in late February abruptly reversed these gains. The developments triggered a sharp increase in volatility across financial markets, including in the EU/EEA. By late March, the Eurostoxx had fallen by more than 10% from its February peak, its steepest correction since the April 2025 tariff-driven selloff. European banking equities were similarly affected, declining by close to 17% from their highest levels of the year in early February. The announcement of a ceasefire in April implied a rise in equity markets, and stocks widely recovered yet volatility remains elevated. Travel, industrials and banking stocks led the rebound, as the sectors most sensitive to energy costs. The Eurostoxx had recovered the bulk of its losses, posting a YtD gain of more than 5%. The Eurostoxx Banks, however, recorded lower gains , reflecting the more complex environment facing European lenders under conditions of elevated inflation and moderating growth (Figure 3).

Source: Refinitiv

Source: S&P Capital IQ
Converging risks of AI, energy and private credit add to an already uncertain outlook
The rapid advancement of AI has been one of the drivers of equity market dynamics for some time now, resulting in cases of overvalued assets. This presents a source of potential financial stability risk, in case investors’ expectations on potential earnings fail to materialise. Private credit has also played a rapidly growing role in AI-related financing (see Box 3 on private credit risks). The Bank for International Settlements (BIS), for instance, suggests that AI accounted for more than a third of private credit deals in 2025 – up from 17% over the previous 5 years – exposing investors to potentially sizeable losses, for example in the event of a sharp correction in data centre valuations[4]. Respective loan repayments could be vulnerable to construction delays, possible AI demand oversupply, as well as electricity supply constraints. The latter could be amplified by the geopolitical tensions in the Middle East. AI has also affected other sectors and led, for instance, to major corrections of software companies in the previous quarters. There are also indications that private credit funds and business development companies (BDCs) have more than insignificant exposures to potentially negatively affected software companies[5]. A recent report by the Financial Stability Board (FSB) highlights that private credit is playing a critical role in addressing the financing needs of data centre investments, particularly those driven by the rapid expansion of generative AI. In broad terms, private credit-related risks – such as interlinkages between private credit funds and banks, borrower credit quality and valuation practices – combine with opaque structures and data gaps[6]. Moreover, the FSB warned of liquidity mismatches in funds, which could trigger broader spillovers into the banking sector that could be amplified by the concerns related to the impact of AI on businesses and the economy. The latter had even negatively affected EU/EEA banks’ equity share prices in February this year.
Uncertain yield outlook also affecting EU/EEA banks
Sovereign debt sustainability remains a key vulnerability for Europe’s financial stability outlook, particularly for high-debt Member States where elevated borrowing costs interact with weak growth prospects, compressing available fiscal space. In this context, increasing sovereign debt through external stress events can trigger a further widening of sovereign spreads, with higher issuance and funding costs bearing most heavily on weaker sovereigns and raising the risk of fragmentation across EA debt markets. The geopolitical shock emanating from the Middle East developments increases the probability of these risks materialising. Following the outbreak of the Iran war, the sovereign bond yields of European countries increased, with spreads relative to risk-free rates widening across most EA countries. This also reflects the higher inflation risks and growth concerns. After an initial increase, yields have partially retraced, although they remain elevated by recent historical standards. For the banking sector, this environment translates into mixed impacts. Higher sovereign yields will presumably exert pressure on banks’ funding costs, and can generate potential valuation losses on sovereign portfolios, contributing to tighter financial conditions and rising credit risk. Yet, if banks increase their sovereign portfolios, they can log higher-yielding bonds – for example as part of their replicating portfolios – and support their future NII (Figure 4).

Source: Refinitiv
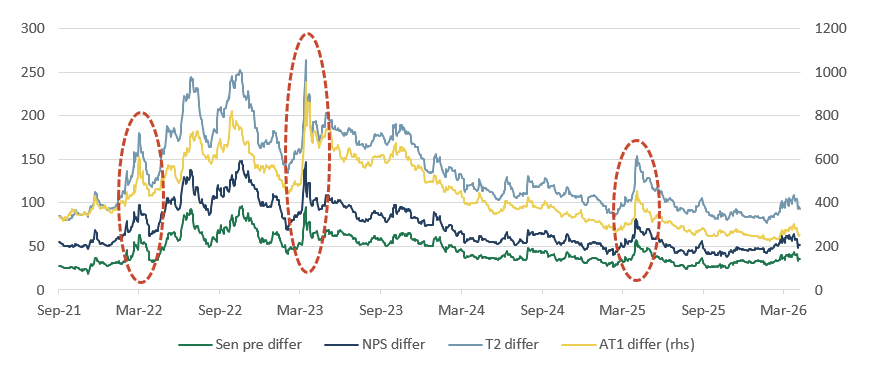
EU/EEA banks’ credit default swap (CDS) spreads spiked amid geopolitical tensions
EU/EEA banks’ CDS spreads, as measured by the iTraxx senior and subordinated indices, remained broadly compressed and relatively stable throughout much of 2025, reflecting the benign credit environment and robust investors’ risk appetite. However, both indices widened sharply from late February 2026 onwards amid the outbreak of the Iran war. The CDS widening contrasted with the moves in cash spreads, as for instance reflected in iBoxx indices (see Chapter 3.1 and Figure 24 below). The subsequent ceasefire announcement in early April triggered a notable tightening in both indices. Notwithstanding this partial normalisation, the episode underscores the sensitivity of banks’ CDS spreads – and subordinated debt in particular, which bears first-loss risk – to geopolitical shocks and the associated repricing of growth and inflation expectations, with spread volatility remaining elevated relative to the subdued levels that prevailed through most of 2025 (Figure 5).
Box 1: EU/EEA banks’ progress in developing approaches to address climate-related risksData from the Climate Policy Initiative (CPI) covering the period 2019-2024 for 180 banks (including 59 EEA banks) shows that EU/EEA banks have strengthened their management of climate risk in recent years[7]. They also tend to outperform peers from other jurisdictions in i) integrating climate-related quantitative targets into their business strategy, and ii) incorporating climate considerations into their governance and risk management processes. This deeper integration of climate factors into strategic and operational frameworks could enhance banks’ resilience as well as their readiness to meet new prudential transition planning requirements. i) Adoption of climate-related quantitative targets EU/EEA banks are increasingly setting quantifiable goals to address climate transition challenges. EU/EEA banks have continuously improved since 2019, signalling higher adoption of climate-related targets such as climate change mitigation targets (e.g. reducing financed greenhouse gas [GHG] emissions), climate investment targets (e.g. volume of green loans or bonds) and/or fossil fuel phase-out or exclusion targets (e.g. restrictions placed on financing new fossil fuel development). EU/EEA banks also compare favourably with other regions on climate-related target-setting practices, with a higher proportion of banks classified in the more advanced categories (Figure 6). More specifically, detailed data show that:
Furthermore, EU/EEA banks currently do not intend to backtrack on their climate objectives. Apart from a few exceptions, EU/EEA banks have neither adjusted their green finance targets downwards in 2025, nor do they intend to revise downwards in 2026; instead, a non-negligible number of banks (29 out of 84 institutions participating in the RAQ) have increased or plan to increase such targets (Figure 8). ii) Integration into governance, risk management and operational processes Climate considerations are increasingly factored into banks’ governance and processes. The proportion of EU/EEA banks classified as either ‘progressing’ or ‘advanced’, based on their performance against the CPI indicators related to climate governance, risk management and disclosure, increased ten-fold between 2019 and 2024 (Figure 9). More specifically, detailed CPI data show that:
Overall, it appears that EU/EEA banks are taking steps to better address climate-related risks and opportunities, despite varying maturity across entities and room for further improvement. This broadly aligns with supervisory observations[8]. Recent regulatory developments, particularly the updated CRR3 (Capital Requirements Regulation 3)/CRD6 package and the ESG-relevant (Environmental, Social and Governance relevant) EBA Guidelines, should help sustain this momentum[9]. |
Gradual credit recovery with strengthening bank–NBFI linkages and shifting intermediation dynamics
EU/EEA banks continued to expand lending at a moderate pace in 2025. Total loans to NFCs and households increased by 2.7% YoY (year-on-year). Growth was broadly balanced across corporate and household portfolios, although with some dispersion. SME lending showed comparatively stronger momentum (+2.9% YoY), while residential mortgages and lending collateralised by CRE expanded more moderately. Consumer credit continued to outpace other segments (+4.7% YoY), albeit from a lower base, while lending to large corporates remained comparatively subdued. Total loans increased by +1.9% YoY. However, this growth was mostly muted in the second half of year 2025 (+0.2%), as higher private sector lending was mostly offset by reductions in cash balances (- 6.9% YoY). Q1 2026 data showed that EU/EEA banks continued to expand their balance sheets, primarily driven by increased holdings of debt securities and derivatives, while lending growth to households and NFCs remained comparatively subdued. Developments vis-à-vis the financial sector also point to evolving intermediation patterns. Exposures to NBFIs, proxied by other financial corporations (OFC) in financial reporting (FINREP), increased by 10.4% YoY, suggesting continued strengthening of bank–NBFI linkages. While this may support credit provision, it also underscores the importance of monitoring risk transmission and vulnerabilities outside the traditional banking sector. The sustained upward trend, albeit with some volatility, suggests that NBFIs are becoming increasingly relevant both as a channel for credit provision and as a potential conduit for spillovers (Figure 10).
Limited risks from direct exposures to Middle East, but elevated geopolitical spillover risks
EU banks’ non-EEA exposures remain sizeable, currently standing at EUR 4.9 tn (+4.3% YoY, and corresponding to nearly 17% of total assets), underlining the importance of cross-border activities for the sector’s balance sheets and risk profile. A significant share of these exposures is concentrated in advanced economies, with around EUR 1.5 tn towards US counterparties and approximately EUR 1 tn towards the UK, reflecting strong financial and economic linkages. While these exposures benefit from generally robust institutional frameworks, supervisory attention is increasingly focused on smaller – but potentially more vulnerable – exposures to regions affected by heightened geopolitical risks, particularly the Middle East. In the current environment, these exposures may be more sensitive to adverse shocks, including commodity price volatility, market and supply chain disruptions, and broader spillover effects from ongoing tensions.
EU/EEA banks’ exposures to Middle Eastern counterparties are limited in size and concentrated in relatively strong credit profiles, suggesting that direct exposures related to the conflict in the region are not a material risk driver for the EU/EEA banking sector[10]. Total direct exposures amounted to around EUR 130 bn at 2025 end, corresponding to less than 0.5% of total EU/EEA banking sector assets. The largest country exposures are to the United Arab Emirates (EUR 55 bn), followed by Qatar (EUR 29 bn) and Saudi Arabia (EUR 23 bn). Smaller but still relevant exposures are observed towards Bahrain and Israel (around EUR 8 bn each), while exposures to other jurisdictions in the region (including Oman and Kuwait) are close to EUR 4 bn. Country-level data also show that exposures are highly concentrated in a few banking systems, with France (around EUR 61 bn) accounting for nearly half of total EU/EEA exposures, followed by Germany (EUR 19 bn), Spain (EUR 19 bn), Italy (EUR 14 bn) and the Netherlands (EUR 13 bn). From a sectoral perspective, exposures to Middle East counterparties are predominantly wholesale in nature, with a significant share towards financial institutions and large corporates, including sovereign-related entities. Around EUR 47 bn of exposures relate to banks and OFCs, while approximately EUR 33 bn are directed to NFC. This composition reflects EU/EEA banks’ role in the region through cross-border financing activities such as project finance, energy-related lending and trade finance, rather than retail or SME lending.
Box 2: Middle East conflict particularly affects energy-intensive sectorsStrong credit demand in sectors such as energy, defence and technology is closely linked to the current geopolitical environment, including the conflict in the Middle East, which is reinforcing investment needs in energy security, supply diversification and strategic industries. At the same time, ongoing geopolitical tensions increase the vulnerability of energy-intensive sectors – such as parts of manufacturing, transport and heavy industry – which remain sensitive to potential disruptions in energy supply, and heightened input cost along with price volatility. Besides energy, the conflict in the Middle East, has also revealed dependencies of global economies to minerals and input materials such as helium or fertilisers affecting the agricultural sector. The impact on the hospitality sector might also be material not only to those countries with proximity of the conflict region, but also for the industry as a whole as energy prices squeeze their margins. Following the outbreak of the conflict in the Middle East, volatility in equity markets increased significantly across all sectors signalling the heightened uncertainty and increased risk perceptions[11]. This was particularly pronounced for carbon-intensive sectors, indicating that oil and gas prices were a key driver of financial markets since the closure of the Strait of Hormuz. This is also evident by the beta estimations vis-à-vis oil and gas prices[12]. The effect is mostly evident for sectors like chemicals, construction & materials, and utilities. A common characteristic of these sectors is their dependency on energy input cost. At the same time, the EU/EEA banking sector also depicted significant volatility, reflecting the assumed second-round effects of the impact of higher energy prices (Figure 11; see also Chapter 1). As of June 2025, EU/EEA banks’ total exposures to sectors that highly contribute to climate change – used here as a proxy for energy-intensive activities – stood at EUR 4.0 tn (around 68% of total NFC exposures of EUR 5.9 tn), based on data reported to the EBA for transition risk[13]. Within this aggregate, manufacturing (NACE C) and electricity, gas and steam supply (NACE D) represent the largest concentrations of energy-intensive credit risk relevant to the current energy price shock, with combined exposures of EUR 1.25 tn. Manufacturing (NACE C) accounts for more than EUR 900 bn (around 23% of total climate-relevant sector exposures) and is the largest channel of vulnerability within the energy-intensive perimeter. The most directly exposed sub-sectors include chemicals (C20, EUR 67.5 bn), basic metals (C24, EUR 51 bn), other non-metallic mineral products incl. glass and ceramics (C23, EUR 36 bn), and motor vehicles (C29, EUR 71 bn). Additional concentrations include paper (C17, EUR 28 bn) and coke and refined petroleum products (C19, EUR 27 bn). The key transmission mechanism presumably affecting vulnerable businesses include for instance margin compression, implying weaker debt-servicing capacity, with the speed of deterioration depending on firms’ ability to pass higher input costs through to customers – often limited in competitive, export-oriented segments such as basic chemicals and basic metals. Exposures to electricity, gas and steam supply (NACE D) also constitute a key vulnerability channel, totalling EUR 341 bn. Electric power generation, transmission and distribution (D35.1) represents EUR 300 bn, of which electricity production accounts for EUR 219 bn. Credit risk is heterogeneous: exposures linked to fossil-fuel-dependent generation assets face direct cost pressures under sustained high fuel prices, while operators with a higher renewable share are comparatively less affected. EU/EEA banks reported a YoY increase in exposures to energy and utilities of close to EUR 30 bn, which might also – but not only – reflect investments aligned with the EU energy transition. Assuming this is at least partially the case, this may support a gradual shift away from fossil-fuel-dependent assets. However, it can also add near-term cost pressures across the sector, on top of those stemming from heightened geopolitical tensions. Beyond manufacturing and utilities, transportation and storage (NACE H) totals EUR 301 bn and is materially sensitive to fuel costs, cognizant of the fact that different sub-sectors can bear the impact in significantly different ways (with the example of e.g. already several airline defaults or restructuring mainly outside the EU/EEA). Mining and quarrying (NACE B) is smaller (EUR 52 bn) but features asymmetric dynamics: higher oil and gas prices may support upstream revenues – particularly crude petroleum and natural gas extraction (B06, EUR 20 bn) – while worsening borrower economics in other, more energy-dependent parts of the corporate portfolio. As of June 2025, EU/EEA banks’ aggregate exposures to the particularly energy cost-sensitive sectors listed above stood at about EUR 1 tn, corresponding to roughly 17% of total NFC exposures[14]. While this share is not dominant in aggregate, it masks considerable cross-country heterogeneity. At country level, the proportion of energy-intensive NFC exposures relative to total corporate portfolios ranges from 7% to 40%, reflecting differences in national industrial structures and banks’ sectoral lending strategies. |
Rising sovereign exposures heighten sensitivity to fiscal slippage and repricing risks
Potentially rising sovereign debt levels could weaken debt sustainability perceptions and negatively affect sovereign yields (see Chapter 1 on this topic). This could feed directly into banks’ balance sheets via valuation losses on their sovereign holdings. Although higher interest rates may provide some offset through stronger NII, sovereign exposures remain a key channel through which both interest rates and fiscal risks could materialise. Total sovereign exposures of EU/EEA banks rose markedly from around EUR 3.65 tn at end-2024 to EUR 4.18 tn at end-2025 (around +14.6%), with exposures relative to Common Equity Tier 1 (CET1) climbing from roughly 206% to 232%[15]. This points to a materially higher sensitivity of banks’ capital positions to sovereign repricing. That said, the risk profile is nuanced. While most exposures (59.5%) are held at amortised cost, a sizeable share – over one third – is still subject to market valuation effects (17.1% at fair value through P&L (profit and loss) and 20.2% through OCI (Other Comprehensive Income)). At the same time, EU/EEA banks’ sovereign portfolios have become somewhat more geographically diversified, with domestic exposures accounting for 44.9%, other EEA sovereigns 30.8%, and third countries 24.2% by end-2025 (Figure 12).
Pressures on rates have resurfaced the interest around banks’ unrealised losses due to their broader bond exposures (i.e. not only sovereign debt portfolios). Although not recognised in banks’ P&Ls, unrealised losses on amortised cost bond portfolios reflect declines in their value. This can have capital and liquidity implications, meaning that, in a rising rate environment, these losses can crystallise under stress (e.g. asset sales, collateral needs), potentially affecting capital and funding positions. EBA supervisory reporting data indicates that unrealised losses have declined over recent years, standing now at around EUR 25bn (ca. 170bps of Tier 1 capital). Monitoring these exposures provides a forward-looking view of interest rate risk, helping identify potential vulnerabilities not captured in their total by accounting figures (Figure 12).
* The unrealised losses presented in the right-hand chart are not limited to sovereign exposures, but also include losses related to other asset classes, including corporate and/or financial institution exposures.
Optimistic balance sheet expansion plans amid rising macroeconomic, geopolitical and NBFI-related uncertainties
Banks’ plans point to a broad-based balance sheet expansion over the coming years, alongside a continued shift from central bank liquidity towards higher-yielding lending. Institutions expect lending to NFCs to increase strongly (above 5% in 2026, moderating thereafter) and household lending to expand steadily (around 3.5–4%), suggesting that banks anticipate sustained credit demand and continued capacity to expand core portfolios. Growth is also foreseen in exposures to OFCs, indicating continued strengthening of linkages with NBFIs. However, the planned expansion may prove optimistic, given the current risk environment. The projections appear to embed a broadly benign macrofinancial backdrop and may not fully reflect downside risks from geopolitical uncertainty, still-tight financing conditions, or potential corrections in vulnerable sectors. In this context, the envisaged increase in corporate and NBFI exposures could be constrained by weaker investment and refinancing activity or by shifts in market-based financing conditions (such as NFCs getting more financing on financial markets through bond issuance), suggesting that realised balance sheet growth could fall short of current expectations (Figure 13; see Chapter 1 on the risks related to economic growth and rate rises).
Broad-based lending growth masks significant cross-country dispersion and market-sensitive volatility
Overall, while aggregate trends remain broadly positive, underlying dynamics differ across countries and portfolio types. Lending growth projections point to pronounced cross-country heterogeneity across all segments, with most jurisdictions expecting at least moderate growth rates and some other jurisdictions reporting more ambitious expansion plans. In the household and NFC portfolios, most countries remain within a range of 3 to 8% annual growth over the three forecasted years, suggesting broadly steady but in some cases aggressive expansion. Large core banking systems such as Germany, France, Italy and Spain consistently report lower and more stable growth expectations, while several central and eastern European countries – including Hungary, Poland and Bulgaria – show structurally higher growth rates, reflecting stronger credit dynamics and asset mixes. Dispersion is wider in more market-sensitive segments, notably lending to OFCs and debt securities, where projections are more volatile and, in some cases, negative. This points to greater sensitivity to market conditions, portfolio rebalancing and the evolving role of non-bank intermediation. A few countries – notably Lithuania – stand out as outliers across several segments, presumably reflecting country-specific factors or base effects. (Figure 14 and Figure 15).
Lending growth accelerates on structural drivers, while geopolitical uncertainty tempers corporate demand
RAQ results also point to lending expansion in the next six to twelve months. Mortgages, consumer credit and SME lending show the strongest momentum. Net expansion intentions in these segments have risen markedly since 2023, consistent with a recovery in credit demand supported by improving sentiment and easing financing conditions. Project finance is also on an upward trajectory, albeit from a lower base, reflecting investment needs in infrastructure, defence and the energy transition. In line with this, banks report particularly strong loan demand in sectors such as energy, technology and defence, underlining the role of both public spending priorities and private investment in shaping lending activity. The planned increase in asset finance may also reflect the growing role of NBFIs in asset-backed and structured financing[17]. As corporates diversify funding sources (including leasing and private credit and bond issuances), banks increasingly interact with NBFIs through co-lending, syndication and originate-to-distribute models. This supports the expansion of asset-based finance while reinforcing interconnected credit intermediation. By contrast, growth expectations for lending to large corporates have moderated, pointing to a more cautious outlook amid persistent geopolitical uncertainty that may weigh on investment decisions and borrowing needs. Overall, future credit expansion is likely to be driven less by a broad cyclical upswing and more by sector-specific investment needs, public spending priorities and structural transformation (Figure 16).
Cross-border lending expected to outpace domestic growth
Banks’ projections point to a clear shift towards cross-border lending as a key growth driver, outpacing domestic activity and led primarily by intra-EEA exposures. In the household segment, lending to other EEA countries is expected to expand by 6.6% in 2026 – almost double the 3.5% growth foreseen for domestic portfolios. The same dynamic is evident for NFCs, where cross-border EEA lending is projected to grow by 7.0%, compared with 4.9% domestically. By contrast, lending to non-EEA counterparties is also expected to increase, but without the same consistency or strength observed within the EEA. This suggests that banks’ expansion strategies remain more firmly anchored within the single market, where regulatory alignment, market familiarity and lower perceived risk continue to support stronger growth expectations. This points to a balance sheet strategy that remains growth-oriented but increasingly outward-looking, but still within the EU/EEA. In other words, banks do not merely expect lending volumes to rise. They also appear to expect comparatively stronger momentum in cross-border EU/EEA business than in purely domestic books (Figure 17).
2.2 Asset quality
Resilient asset quality despite rising geopolitical risks
Despite elevated macroeconomic uncertainty and the heightened geopolitical tensions, asset quality in the EU/EEA banking sector remained broadly unaffected at aggregate level in 2025. NPL volumes stabilised, near their lowest levels (EUR 370 bn in December 2025, or 1.82% of total loans) supported by the easing of interest rates and continued strength in labour markets, which have helped sustain borrowers’ repayment capacity. Data for Q1 2026 confirms this trend, with only a minor increase in NPL volumes. However, this resilience at headline level masks growing heterogeneity across countries and portfolios, suggesting that underlying vulnerabilities persist. In 2025, German and French banks saw their NPLs rise by 6% and 4% respectively, while Spanish and Italian banks reported notable drops of 8% and 12%. However, despite the considerable changes in NPL volumes, the ratio of NPLs to total loans in these countries remained nearly unchanged compared to the previous year.
Although NPL ratios remain contained across most portfolios, differences across segments persist. For non-financial corporations, the ratio edged down to 3.3%, with SMEs – while still the most vulnerable segment – also showing a slight improvement to 4.4%. CRE exposures also exhibit some easing from elevated levels to 4.1%, while large corporates remain at a comparably lower level of around 2.5%. On the household side, resilience persists, with the overall NPL ratio declining to 2.0%, driven by mortgages in particular (1.3%). Consumer credit remains the main outlier, with NPL ratios broadly stable at higher levels of around 5.4%.
The broadly improving trend is mirrored in Stage 2 allocations, which, on average, also declined across most portfolios in 2025, signalling an improvement in underlying credit risk. For NFCs, Stage 2 exposures fell from 13.4% to 12.8%, with decreases across SMEs, CRE and large corporates, although the former two remain elevated. The share of Stage 2 loans in households also declined from 9.2% to 8.5%, supported by improvements in mortgage portfolios, while consumer credit shows only a marginal reduction and remains the riskiest segment. Overall, the combined NFC and household Stage 2 ratio declined to 10.5% as of the end of 2025, reinforcing the view of a slow but ongoing normalisation in asset quality, albeit with persistent vulnerabilities in higher-risk segments. Q1 2026 data show a modest increase in the volume of Stage 2 exposures. However, the aggregate Stage 2 ratio remained broadly unchanged and has not, shown evidence of a material deterioration in credit quality in the quarter.
While these developments point to continued stability, the outlook is subject to increasing downside risks. In particular, renewed geopolitical tensions in the Middle East and the potential for higher energy input costs could weigh on growth, erode household disposable income and increase cost pressures for corporates. The impact of higher energy prices may, for instance, extend well beyond sectors with high direct energy dependency. Persistent increases in production and transportation costs could continue to exert upward pressure on inflation. This may contribute to a more prolonged period of tight financial conditions, weighing on households’ real disposable income and corporates’ profitability. At the same time, a slower-than-expected energy transition and continued structural dependence on gas and oil imports could increase the vulnerability of the European economy to renewed commodity price shocks and geopolitical disruptions. Such developments may gradually erode purchasing power, dampen private consumption and investment, and ultimately weaken medium-term growth prospects. For the banking sector, these second-order effects could materialise through a broader deterioration in asset quality beyond directly affected sectors. Banks may therefore need to closely monitor indirect transmission channels from persistent energy-related inflation and weaker growth into credit risk developments across a wider range of portfolios.
Gradual NPL improvement expected, but country-level divergences and sectoral risks persist
Despite the challenging macroenvironment, according to funding plan data, the aggregate NPL ratio stood at around 1.64% in 2025 and is projected to gradually decline to 1.56% by 2028[18]. A similar pattern is observed across key portfolios, with the household NPL ratio expected to ease from 1.26% to 1.21%, and the NFC ratio from 2.07% to 1.96% over the same horizon (Figure 18). This overall stability points to the continued support from more benign interest rate levels, alongside resilient labour markets and generally prudent risk management practices. Together, these factors appear to be sustaining borrower repayment capacity and containing credit risk across the main lending segments. However, amid geopolitical developments in the Middle East and the disruptions in the supply of energy to the global economy, the outlook on asset quality could come under further pressure.
Forward-looking data from NPLs point to significant heterogeneity across countries, with generally moderate increases at aggregate level masking more pronounced dynamics in specific jurisdictions. For households, several countries – particularly in central and eastern Europe – are expected to see strong increases in NPLs over the 3-year horizon, with more pronounced rises in countries such as Lithuania, Latvia and Estonia. By contrast, more stable or even declining trends are projected in some western European countries, including Germany, Spain and Portugal. A similar pattern is observed for NFCs, where overall trends remain contained but country-level projections vary widely. While many countries show moderate increases, some jurisdictions again stand out with significantly stronger projected growth in NPLs, notably in parts of the Baltic and Central and eastern European regions. At the same time, some countries are expected to experience stable or declining NPL ratios, pointing to more resilient corporate sectors. The projected divergence in NPL developments should be viewed in context, taking into account differences in portfolio growth, initial NPL levels and portfolio composition. Overall, the projections suggest that while systemic asset quality risks remain manageable, vulnerabilities are increasingly concentrated in specific segments, underlining the importance of a granular management of credit risk. However, they will of course also depend on how the conflict in the Middle East further evolves and may affect asset quality more broadly (Figure 19).
Furthermore, RAQ results show that expectations of asset quality deterioration remain concentrated in a limited number of portfolios and have generally eased over time for the next 12 months. Concerns are most pronounced in CRE and SME exposures, although the share of banks expecting a deterioration in these segments has declined compared with previous periods. Consumer credit also shows a non-negligible but stabilising level of concern, while large corporates exhibit more moderate and relatively contained expectations. By contrast, other portfolios – including residential mortgages, trading, and specialised lending segments – show only very low shares of banks anticipating a deterioration (Figure 20).
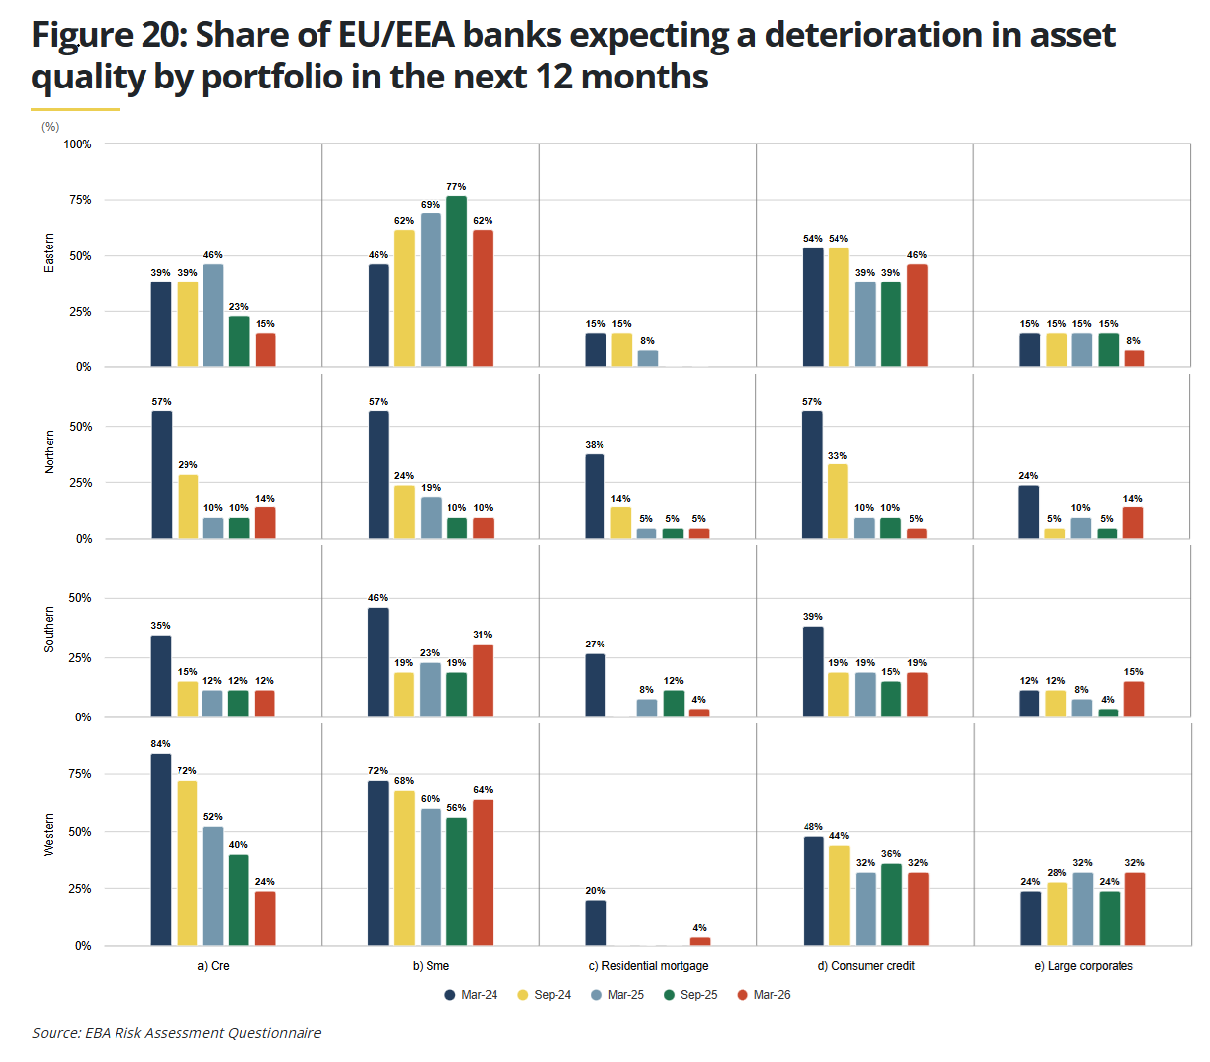
*For the purpose of this analysis, western European countries include Austria, Belgium, France, Germany, Luxembourg and the Netherlands. Eastern European countries include Bulgaria, Czechia, Hungary, Poland, Romania, and the Slovak Republic. Nordic European countries include Denmark, Estonia, Finland, Iceland, Ireland, Latvia, Lithuania, Norway and Sweden. Southern European countries include Croatia, Cyprus, Greece, Italy, Malta, Portugal, Slovenia and Spain.
Box 3: Private credit markets: growth, vulnerabilities and emerging risksPrivate credit markets have grown rapidly and are becoming an increasingly important source of corporate financing, especially for middle-market borrowers in Europe and globally[20]. Following several high-profile defaults in the US and the UK in late 2025, market indicators have started to show signs of pressure in certain segments of the private credit market. The S&P BDC Index (Figure 21 (left)) has fallen to a level not seen since the end of 2020, indicating weaker investor demand for listed private credit vehicles. These vehicles currently offer dividend yields of around 13% based on S&P data, yet they are trading at a discount to their reported net asset value, with market prices averaging at around 80 to 85 cents on the dollar. These discounts may reflect investor scepticism regarding valuations and potential credit losses. Based on ownership data by market value, institutional investment managers hold around one fifth of S&P BDC constituents, while banks (4%) and hedge funds (3%) are smaller, yet still relevant investor groups[21]. In parallel, indexed stock prices of alternative asset managers have declined in recent months, possibly indicating weaker market sentiment towards private market investment strategies (Figure 21 (right)). The growth in private credit markets may, to some extent, reflect structural shifts in financing, including tighter bank lending conditions following post-crisis regulatory reforms and strong investor demand for higher-yielding assets, including from retail investors. At the same time, the need for large-scale private investment related to defence, climate transition and digitalisation may support further expansion[22]. Although private credit can support corporate financing, its rapid growth increases the importance of assessing potential risks to banks and financial stability, not least amid possible direct and indirect interlinkages between financial market participants. Credit quality risks may be increasing as higher interest rates expose vulnerabilities related to high leverage, weak profitability and weaker debt service capacities, and looser underwriting standards. Some market participants have warned that the private credit market may be entering a late stage of the credit cycle, as evidenced by rising borrower leverage, growing defaults and refinancing pressures, sectoral concentration risks and increasingly aggressive underwriting practices. Furthermore, in recent months, segments of the software sector – an example of a sector in which BDCs are invested – have faced increased scrutiny amid uncertainty related to AI-driven business model disruptions (see Chapter 1 on AI impact and private credit exposure to AI and to software companies). If interest rates remain high, including in the event of renewed inflationary pressures, stress in more leveraged segments could intensify. Loan modifications such as payment-in-kind interest, covenant amendments and maturity extensions may delay the recognition of defaults while increasing the potential severity of losses. Limited transparency and opaque valuation practices may complicate risk assessment and delay the recognition of credit deterioration during periods of market stress. Data gaps and fragmented reporting further constrain the assessment of borrower leverage, portfolio correlations and risk concentrations across sectors. Redemption pressures have emerged in some semi-liquid vehicles that offer investors periodic liquidity, while new investments have slowed down. These vulnerabilities are not new, as open-ended real estate funds offering daily liquidity have faced similar run risks during past periods of stress when redemptions have exposed liquidity mismatches. In several recent cases, redemption requests temporarily exceeded the usual quarterly limit of around 5% of the net asset value. Some funds have resorted to dividend cuts, asset sales or sponsor liquidity to honour redemption requests. Anecdotal evidence suggests that these pressures remain concentrated in retail investor flows, while institutional allocations appear more stable. More broadly, liquidity mismatches in funds investing in illiquid loans could amplify stress through forced asset sales or the activation of liquidity management tools, such as redemption gates. If their liquidity buffers are depleted, it could also lead to drawdowns on committed bank credit lines. Banks’ collateral revaluations on such facilities may also reduce the borrowing capacity of private credit funds and could indicate growing caution regarding underlying loan valuations and recovery assumptions. Interlinkages between banks and private credit markets are growing, which may result in stress being transmitted across banking and non-bank financial systems. Banks provide private credit funds with financing through credit facilities, collateralised lending arrangements, and other structured financing transactions. Banks may also share exposure to firms owned by private equity sponsors and financed through leveraged loans or direct lending structures, and may provide financing for private credit fund investors. These arrangements can create multi-layered leverage involving borrowers, funds and underlying investors. During periods of market stress, correlated drawdowns on credit lines or refinancing pressures could cause actual exposures to become much larger than initially thought. Spillovers could also arise through links with insurers, whose increasing private credit exposure could create additional transmission channels to banks and financial markets. One possibility to approach parts of the interlinkages between EU/EEA banks is through EBA large exposure data. This data shows that there are partially material interlinkages between banks and private credit markets. However, data limitations prevent isolating the proportion of these exposures specifically linked to private credit strategies, as they more broadly reflect exposure to private credit funds as well as related asset managers engaged in private credit activities. These exposures do not cover all previously described lending activities, and they may on the other hand go beyond those activities. For example, they may include the financing of asset managers that are engaged in the management of private credit funds. EU/EEA banks’ total exposure to private credit funds and related asset managers with private credit activities reached nearly EUR 150 bn in June 2025 – with the largest share attributed to G-SIIs – spread across 79 banks in 13 Member States (Figure 22 (left)). On average, these exposures represent 0.6% of total assets (0.8% for G-SIIs (Global Systemically Important Institutions), 0.4% for O-SIIs (Other Systemically Important Institutions), and 1.2% for other banks), ranging from 0.01% to 9.4% across the least and most exposed institutions. These levels are in line with figures reported in other analysis, where private credit exposures account for less than 0.5% of total assets[23]. Eleven banks – comprising two G-SIIs, two O-SIIs, and seven other banks – have exposures exceeding 2% of their assets. Geographically, exposures are primarily directed towards US entities, followed by Luxembourg, France and Switzerland (Figure 22 (right)), for exposures for which these data are reported. However, the country of domicile remains unidentified for half these exposures. It must be stressed that actual private credit related exposures – or those with presumably similar risks - differ, because they also comprise all exposures below the large exposure limits and for instance exposures to private credit investors that might be secured by their investments in private credit funds, or parallel lending of banks and private credit funds to the same borrower[24]. Private credit markets are sensitive to macro-financial conditions affecting borrower solvency and investor demand. Higher policy rates or adverse shocks could increase debt-servicing burdens for leverage borrowers and contribute to credit deterioration. Conversely, lower rates may reduce the relative attractiveness of floating-rate private credit investments as yield premiums narrow. A sustained weakening of investor demand or a retrenchment in private credit supply could tighten financing conditions in leveraged loan markets, where private credit funds have become important lenders. These dynamics could amplify the transmission of macro-financial shocks to corporate financing conditions. While private credit remains substantially smaller than bank lending in the EU/EEA, it is becoming an increasingly important component of the broader financial ecosystem. Banks may face direct and indirect credit risks through shared borrowers and financing commitments to private credit vehicles. Effective risk management therefore requires banks to aggregate exposures across business lines and monitor concentrations of risk linked to private credit markets. These developments call for continued supervisory monitoring of private credit exposures and their interactions with banks and other financial institutions, alongside greater transparency and disclosure of exposures to support effective risk assessment. |
Deposits remain the cornerstone of funding mixes
Banks grew their liabilities by 3% in 2025, reaching EUR 27 tn as of 2025 year-end. Deposits remain the most important source of funding. Other customer deposits, which also include deposits from NBFIs, increased the most, rising by around 7% and reaching a share of 12.4% of total liabilities in Q4 2025. Deposits from households also marginally increased, while deposits from NFCs increased by less than 1% in 2025. Other liabilities, which include deposits from central banks, decreased the most, by around 2%, implying that a temporary increase in other liabilities observed in H1 2025 was reversed. These trends confirm banks’ past intentions to focus on deposits as the most important source of funding in their funding mix, as expressed in the previous two RAQ results[25]. The reliance of central bank funding continued to retreat in 2025. This is not least reflected in decreasing other liabilities as a percentage of total liabilities, which include deposits from central banks, and fell from 13.1% in Q4 2024 to 12.8% in Q4 2025.
Growing relevance of senior preferred instruments in market-based funding
The decreasing relevance of debt securities issued in funding mixes in 2025 is confirmed in market data, which show that issuance volumes of covered bonds, and of most unsecured debt instrument types, decreased in 2025 compared to previous years. Yet, within debt securities, the issuance volume of senior preferred instruments increased in 2025 compared to 2024. The trend continued into 2026. Issuance volumes of senior preferred instruments were higher on a YtD basis since the start of 2026. The trend of reduced issuance volumes in 2025 reversed for covered bonds this year, with increased issuances in the first 5 months of 2026. This confirms a previously seen trend of banks’ rising interest in this instrument, based on historical RAQ results (Figure 23). The share of green bonds issued has increased for all instrument types in 2025 compared to the previous year and continued to increase for most instrument types until May 2026. This seems to confirm that green bonds have established their role as a mainstream funding instrument for a broad range of issuing banks, including smaller ones and those accessing funding markets less frequently.
* Based on publicly available market data, which does not reflect the same group of banks covered in supervisory reporting data and which may not completely reflect all issuances of the different types of debt and capital instruments.
Resilient bank funding markets despite elevated geopolitical uncertainties
Primary bank funding markets were overall resilient in the first months of 2026. High issuance volumes of both secured and unsecured bonds were reported in the first 2 months of the year, with a focus on covered bonds, and for unsecured debt with a focus on minimum requirement for own funds and eligible liabilities (MREL) eligibility. Solid investor demand amid broadly stable spreads for bank funding instruments drove issuance activity at the beginning of this year, in spite of some volatility and concerns about geopolitical risk and tariffs. Spreads increased and issuance activity temporarily slowed when the Iran war broke out at the end of February and reflected escalating geopolitical uncertainty and a sharp rise in energy prices. Yet unlike previous episodes of crisis situations, for example following the announcement of new tariffs in the US in April 2025, minor bank issuance activity continued and spread hikes were less pronounced (Figure 24). EU/EEA bank issuance activity in line with long-term average issuance volumes resumed about two to three weeks after the start of the war. Issuances shifted to EUR denominations again, after USD was the preferred issuance currency at the onset of the war and included smaller banks and those accessing funding markets less frequently.
Senior preferred bonds, as banks’ most relevant market funding instrument, are also one of the key components that EU/EEA banks, independent of their size, used to meet their MREL-related funding needs. They offer price advantages for issuing banks compared to more subordinated instruments, and this is contributing to issuance volumes of senior preferred bonds. Well-functioning funding markets for these instruments are important for all groups of banks, including to meet their ongoing MREL requirements. Issuance volumes of covered bonds were higher in the first 5 months of 2026 than the first 5 months of 2025, not least reflecting high primary market activity at the beginning of 2026. However, this might be due, among other things, to a base effect of low issuances in the 2025 reference period. Issuance volumes were nearly the same for Additional Tier 1 (AT1) as well as T2 (Tier 2 capital) instruments and non-preferred senior bonds (incl. those issued from holding companies [HoldCo]).
*With regards to IHS Markit in this chart, and any further references to it in this report and related products, neither Markit Group Limited (‘Markit’), its affiliates, nor any third-party data provider make(s) any warranty, express or implied, as to the accuracy, completeness or timeliness of the data contained herewith, nor as to the results to be obtained by recipients of the data. Neither Markit, its affiliates, nor any data provider shall in any way be liable to any recipient of the data for any inaccuracies, errors or omissions in the Markit data, regardless of cause, or for any damages (whether direct or indirect) resulting therefrom.
By late May, spreads for all instruments across the capital stack decreased again to levels seen before the conflict started, supported by reduced immediate concerns after a ceasefire in the Iran war. However, volatility remains heightened while the conflict continues and energy prices with supply concerns remain high.
3.2 Funding plans
EU/EEA banks’ funding is strongly dependent on client deposits, and banks’ intention is to further enhance this[28]. Based on funding plan reporting, household deposits have a share of around 30% of total liabilities, which rises slightly over the covered time horizon. They are followed by NFC deposits (around 17%), whose share is planned to slightly increase during the next 3 years, and long-term unsecured debt instruments (around 10%), whose shares are expected to remain stable until 2028. Deposits from OFC – which include private credit funds and other NBFIs – account for a share of around 7% in 2025, which is expected to remain constant for the coming years[29].
Banks’ plans incorporate relatively ambitious client deposit growth assumptions
During the forecast period, liabilities are assumed to rise by 3.5% this year and around 3% p.a. in 2027 and 2028. Deposits are the part of banks’ liability mix that EU/EEA banks want to grow the most over the forecasted period, with a relatively constant growth rate of ca. 4% for household and NFC deposits. Only repos and other liabilities show partially higher planned growth rates (at 8% and 6% respectively in 2026). The planned growth rate for market-based funding is between 2% and 4% for different kinds of instruments, with, for example, long-term secured bonds – such as covered bonds and securitisations – to rise 4% this year, in contrast to a 2% growth rate for unsecured bonds in 2026. It shows that last year’s extraordinarily strong activity in unsecured debt issuance and only subdued activity in secured placements might again move back to a more common focus on covered bonds in EU/EEA banks’ primary market activity (Figure 25; see also Figure 23 and related text in Chapter 3.1 on last year’s primary market activity).
Growth assumptions for total liabilities, notably for some components, seem relatively ambitious, not least compared to the expected GDP growth rates for respective years (see Chapter 1 on forecasted GDP growth rates). In particular, the growth rates for household and NFC deposits look optimistic and might even imply a pricing competition in case banks really need to increase their client deposits to attain those growth rates to refinance their asset side, for example. This concern could be further amplified by some first indications that issuance activity in market-based funding has been lower than originally planned for this year, with e.g. actual YtD issuance volume not in all cases reflecting the planned increase in primary market activity for this year. Banks might accordingly need to gain even more client deposits – and even more than already originally planned – as a replacement for lower than planned bond issuance volumes (on YtD issuance activity this year, see Figure 23 and related text above in Chapter 3.1). This concern might be more relevant for smaller banks, which might depend even more on client deposit-based funding.
Planned primary market activity in unsecured debt instruments appears somewhat elevated
Funding plan data show that senior preferred debt makes up the biggest share in forecasted unsecured debt placements. The increase in the planned gross issuance volume of senior preferred debt (in the chart, ‘other long-term unsecured instruments’) is particularly pronounced in 2026 (around +50%). This is not least due to a major rise in maturing volumes of this debt class, but also contributes to its rising share in outstanding unsecured debt instruments in the forecasted years. The rise in the preferred senior debt issuance volume in 2026 follows a year for which market data indicates already comparatively high issuance volumes (see Figure 23 and related text above, as well as further coverage of primary market analysis in Chapter 3.1). This means banks are planning a major rise in issuances in this debt class, which might already have seemed like a challenge before the Iran war broke out, with its further escalation of geopolitical uncertainty. Looking beyond 2026, planned gross issuance volumes of senior preferred debt are assumed to stay almost stable in 2027 and to decline in 2028 by around 10% YoY.
Non-preferred debt issuances are also assumed to see a major rise in issuances of around 40% in 2026. Non-preferred senior debt issuance volumes are assumed to rise by another 11% in 2027, before declining again by around 11% in 2028. These moves are also driven by maturing debt as well as balance sheet expansion. What might be helpful for banks to place rising issuance volumes of non-preferred debt is that the placement of HoldCo debt is planned to significantly decline this year, by around 50%. In summary, non-preferred senior and HoldCo debt is as such assumed to decline by around 9%. However, this is followed by a rise of nearly 20% in HoldCo debt issuance in 2027, which means that banks might face certain challenges in non-preferred and HoldCo debt placements next year. In 2028, issuance volumes of HoldCo debt are again assumed to decline by ca. 8%, similar to non-preferred instruments. Related to subordinated debt, AT1 issuance volumes show a partially strong rise during the forecasted years (though at rather low volumes of between ca. EUR 15bn and EUR 20bn), with high net issuance volumes. T2 debt shows, by contrast, negative net issuance in 2026 and 2027, which explains their declining share of outstanding unsecured debt (Figure 26).
Overall, planned issuance volumes appear elevated across many segments, even before accounting for geopolitical developments in the Middle East since March this year. The already ambitious plans are now facing increasingly volatile funding markets, which may limit some banks’ ability to place bonds as planned. This might imply a need to increase the share of deposits or repos in the funding mix. However, growth assumptions for these instruments also already appear somewhat elevated, as noted above. If banks cannot meet their funding needs, either through market-based or deposit funding, this might imply that they may need to use liquid assets for new lending, for instance, reducing their liquidity positions, or reduce asset growth, putting lending to the economy at risk.
Looking at the composition of outstanding stock of unsecured debt instruments, funding plan data show that preferred senior debt (in the chart, ‘other long-term unsecured instruments’) has the largest share, at 50.4% in 2025. Amid the above-described increase in issuances, this share rises to 53.4% in 2028. The share of non-preferred and HoldCo senior debt is, in summary, projected to decline during the same period, from 36.0% to 33.7%. These developments might not least be due to a rebalancing of the preferred vs non-preferred/HoldCo composition of senior debt. Besides preferred senior debt, only AT1 instruments’ share is also planned to increase, from 3% to 3.4%, amid the partially high net issuance volumes in the forecasted years, as described above. The share of all other debt classes is assumed to decline (Figure 27).
Funding plan data also show strongly rising covered bonds issuances in 2026
Planned primary market activity in covered bonds and asset-backed securities (ABS) is projected to rise sharply in 2026, exceeding the increase expected for instruments such as senior preferred debt, and surpassing 100%. While this partly reflects a significant increase in maturing volumes, it also implies a substantial rise in net issuance volumes. At the same time, EU/EEA banks plan to significantly increase the volume of retained covered bonds, ABS and similar instruments (Figure 28). The latter is presumably a somewhat easy and straightforward process, assuming that the required collateral is available. It also ensures that banks have easily encumberable assets – such as covered bonds – quickly available in case of need, for example for gaining access to central bank funding in case of major market stress (see Chapter 3.3 on asset encumbrance).
However, the strong increase in primary market activity for covered bonds may raise some concerns. At the same time, it might also be understood that the higher covered bond placements might not least reflect the challenging geopolitical environment. Looking at EU/EEA banks’ issuance activity in the past, there is an apparent pattern that banks seem to issue more covered bonds in times of stress or in crisis times. This means that primary market activity is more driven by covered bonds in times of crisis than by senior unsecured and subordinated debt. This indicates that covered bond primary markets also still provide access at presumably more reasonable prices than other bank funding market segments. This was particularly pronounced when the Covid pandemic broke out in 2020, and when Russia’s full-scale invasion of Ukraine commenced in 2022. However, it was less pronounced – but still observable – during the Silicon Valley Bank (SVB)-induced crisis in the US in 2023, and following the announcement of new US tariffs (‘liberation day’) in 2025. However, it should be noted that the pattern of higher covered bond issuance was not as evident during the first weeks of the Iran war in March 2026. But this comes in parallel to a less significant increase in ASW spreads of banks’ funding instruments at that time, which means that the pricing of bank funding did not show major spikes as in other crisis periods. During the latter, ASW spreads had widened more significantly (Figure 29). The results of this analysis might suggest, among other things, that covered bonds can also be issued in case of a deterioration in the geopolitical situation – but the assumed material rise in covered bond issuance volumes in 2026 compared to the previous year might still be challenging.
Figure 29b: ASW spread differentials vs covered bonds, by seniority, over time *
Source: Dealogic, Markit IHS iBoxx, EBA calculations
* For the lefthand chart, the stress/crisis months are related to the Covid-outbreak in 2020, the Russian war in 2022, the SVB-induced crisis in 2023, and ‘liberation day’ in 2025. For the righthand chart, the red circles show selected stress/crisis events in the following order: Russian war, SVB-induced crisis, US tariffs – ‘liberation day’. Furthermore, note that, amid the IBOR-related changes, respective ASW spread data are only available from 2021. However, an analysis of yield differentials confirms the spread differential-based results and also shows that, in previous crisis periods, such as the Covid outbreak in 2020, the reaction of covered bond spreads was more contained than those of other funding instruments. The analysis was done as at mid-April.
LCR and NSFR expected to decline in 2026
EU/EEA banks’ liquidity coverage ratio (LCR) stood at 160% as at the end of 2025, as reported in funding plan data. It was nearly stable YoY based on Risk Dashboard (RDB) data, amid relatively similar moves of the numerator and denominator. However, historical data show that the rise in the share of central government assets in high-quality liquid assets (HQLA) further increased YoY, from 27.3% as of YE 2024, to 30.9%. The share of other components also increased, whereas the share of cash and central bank reserves declined from 47.7% to 41.3% YoY (see previous analysis and deep dive in the 2025 autumn edition of the EBA’s RAR).
For 2026, EU/EEA banks expect a drop in the LCR to 155% amid a decline in the HQLA and a rise in net liquidity outflow. The decline in the HQLA this year comes in parallel with a planned decline in cash and cash reserves at central banks (see Chapter 2.1 on asset growth)[31]. Developments in Q1 showed a contraction of the LCR, which on the one hand may confirm the expected decline for this year, but on the other hand also reflects some seasonality. EU/EEA banks’ net stable funding ratio (NSFR) is similarly expected to decline this year, from 127% (YE 2025) to 125% (YE 2026), and then to gradually increase back to 127%. The NSFR declined somewhat in the first quarter, which may confirm the expected contraction this year. The reason for this assumed development is that the available stable funding (ASF) as numerator increases less than the required stable funding (RSF) in 2026, but then accelerates its growth rate again. The assumed developments seem to broadly fit into other parts of the funding plan data and would not indicate any major deterioration in banks’ liquidity and funding position in the quarters and years to come. However, these developments come with the caution raised above concerning partially ambitious funding plans.
FX funding positions are expected to remain broadly unchanged
Funding in foreign currency (FX), i.e. non-EU/EEA currencies, is mainly driven by household and NFC deposits, with some dispersion among currencies[32]. USD liabilities are, for instance, more driven by issued debt securities, and far less by client deposits. The main foreign currencies outside the EU/EEA are USD, GBP and CHF. On a systemic level there is a funding gap for CHF and GBP (i.e. EU/EEA banks have more assets than liabilities in the respective currencies), whereas there is a funding overhang for USD on a systemic level (i.e. larger USD liabilities than corresponding assets, and the overhang in EUR terms reaching around EUR 1.4 to 1.5tn during the covered years)[33]. At bank level there are partially diverging trends. For USD, there are, on the one hand, several major and other somewhat large banks that seem to use USD as funding currency and have a funding overhang. These mainly tend to be institutions with no US operations, even though there are also exceptions to this rule. Banks with a USD funding gap seem to be particularly institutions that have US operations and/or not insignificant investment banking activities. Banks with GBP and CHF as significant currencies include those with operations in countries where these currencies are commonly used, but also some institutions with major investment banking operations. During the forecasted years, some FX funding positions slightly widen, whereas others contract somewhat, i.e. there is no clear trend in the planning horizon, meaning banks broadly aim to keep their currency positions the way they are (Figure 31).
* In the right-hand chart, a positive value means that a bank has more assets than liabilities in USD, whereas a negative value means that a bank has more liabilities than assets in USD (note that all values in EUR using the same FX rate).
3.3 Asset encumbrance
Asset encumbrance trends show increasing pledged assets but the share of pledged assets still remains at moderate levels
The asset encumbrance ratio (i.e. the ratio of encumbered assets and collateral received to total assets and collateral received that can be encumbered) rose in 2025, reaching 24.7% in December 2025, representing a modest increase of 60bps compared to 24.1% in December 2024 (Figure 32). Over this period, the stock of encumbered assets (the numerator) increased by around 7%, while the total volume of assets and collateral eligible for encumbrance (the denominator) rose by 4%. Despite the higher growth of the numerator than the denominator, this development points to a still broadly resilient funding and collateral profile. Q1 2026 data show that asset encumbrance has increased notably.
There is significant dispersion among countries. Danish banks, for instance, report the highest asset encumbrance, reflecting their extensive reliance on covered bond issuance as a core funding mechanism (Figure 33). By contrast, Lithuania, Latvia and Croatia show the lowest ratios, consistent with more limited use of secured funding instruments.
Encumbrance has shifted from loans to debt securities
Looking at the instruments used for encumbrance, the data show that debt securities have recently contributed more strongly to encumbrance, in contrast to loans. The share of debt securities rose steadily from around 36% in 2018 to 52% by December 2025 (Figure 34). This development reflects a decline in the European Central Bank’s (ECB) Targeted Longer-Term Refinancing Operations (TLTRO) and similar measures, which allowed for loans as collateral, for instance. In contrast to loans, debt securities can typically be used across a wider range of secured funding transactions, including for most commonly used repo transactions, which can be mobilised relatively quickly in the event of funding needs. At the same time, loans continue to play a role for specific instruments, such as covered bonds. In particular, mortgage loan portfolios provide stable and predictable backing, supporting access to secured funding.
Total assets increased modestly from around EUR 30 tn at the beginning of 2025 to approximately EUR 31 tn by year‑end (Figure 35)[35]. Central bank‑eligible assets, which amounted to around EUR 5 tn, showed a slight downward trend over the year, with their share in total assets declining marginally by around 20bps YoY by the end of 2025, while still representing a stable and significant liquidity buffer. This can be particularly helpful in times of stress, which can materialise faster than one might expect these days, not least amid high geopolitical risks.
Repos remain the dominant reason for asset encumbrance
The structure of asset encumbrance – meaning the reasons why banks encumber assets, or ‘sources’ for encumbrance, as referred to in the respective reporting – remains broadly stable. Repos remain the dominant reasons for encumbrance, increasing from 34.0% in December 2024 to 36.3% by YE2025 (Figure 36). It confirms the role of repos in EU/EEA banks’ funding, which is also reflected in their funding plan data, assuming strongly rising volumes this year (see Chapter 3.2). Covered bonds remain the second-largest reason for encumbrance, though with a gradual decline from 23.3% to 22.2% throughout the year, which presumably reflects the subdued issuance activity in this segment in 2025 (see Chapter 3.1 and 3.2 on banks’ funding and funding plans). By contrast, reliance on central bank funding has remained limited and broadly stable, at around 2.0%. Other sources of encumbrance, including collateralised deposits and derivatives-related exposures, have exhibited only minor fluctuations.
Operational risk continues to rise
Operational risk and operational resilience remain key considerations for the banking sector. The relevance of operational risk has further increased, not least because of technological developments and amplified by geopolitical tensions, while risks to operational resilience have become increasingly interlinked and complex. Digitalisation, including the rapidly increasing capabilities of AI, and technological advances with high cyber and digital fraud risks, continue to be the key driver of operational risk. These drivers are amplified by interlinkages with geopolitical tensions, with an increased risk of state-sponsored malicious cyber activity, including against the banking sector. Risks of malicious behaviour such as potential acts of sabotage, which may affect financial infrastructure, also increase with geopolitical tensions and ongoing conflicts. A high dependency on third-party ICT service providers such as cloud service providers, and service providers in the area of payment schemes, for example, amplifies the risks. These providers are often domiciled in third countries outside the EU/EEA, which might limit the scope for monitoring and for adequate responses in case of materialising risks. Results from the RAQ on non-EU/EEA dependencies show that banks consider ICT service provider-related dependencies as the biggest challenge (ca. 80%), and most of them have at least partially addressed those challenges. The latter responses confirm anecdotal evidence. Payment solution-related dependencies are the second-highest material risk in banks’ views (ca. 60%) (Figure 37).
EBA supervisory reporting data also reflect increasing operational risk. EU/EEA banks reported a total of approximately 3.9 million loss events in 2025, increased by 25% compared to 2024. The impact of losses related to operational risk has nevertheless decreased. Total materialised losses from new operational risk events and loss adjustments relating to previous periods reached EUR 15.2bn in 2025, which is 5% lower compared to 2024. The decreasing volume of new operational risk losses, amid an increasing number of loss events, might indicate a recent lesser direct financial impact from increasing operational risk events.
Operational risk has become systemic with its wide scope
The impact of potentially materialising risks in the banking sector and financial infrastructure could be significant and highlight the necessity to safeguard the continued trust of customers and operational resilience. Beyond ICT-related risks, the risk of fraud and of financial crime, including money laundering risks, conduct, legal and reputational risks, remain high and are being closely monitored by financial institutions and supervisors. The materialisation of such risks beyond those related to ICT can incur substantial litigation costs.
Risks to operational resilience have become increasingly systemic. Capital requirements for operational risk are the second most important component of banks’ risk weightings after credit risk. They increased sharply to 13.4% of total capital requirements at 2025 end (10.6% in December 2024). A large majority of jurisdictions, including larger ones, shows increasing capital requirements, with rather low dispersion. Increasing capital requirements in 2025 are to some extent driven by new rules regarding the calculation of operational risk introduced with the CRR3, which have been applicable since 2025[36].
Cyber and ICT-related risks remain key risk drivers, followed by fraud risks
RAQ responses also confirm the high relevance of cyber risk and data security, which continue to be considered the most relevant driver of operational risk in the current and most recent iterations of the RAQ. Yet the agreement on cyber risk and data security as key operational risk drivers decreased, with 74% agreement in the spring 2026 RAR compared to 82% agreement a year ago. As agreement on related risks of IT failures (at 31%) and of fraud (at 52%) similarly decreased, this may indicate some improvements in banks’ management of technology-related risks (Figure 38).
* Agreement on up to three options was possible for respondents.
Fraud risk has grown sharply in the last 3 years and is considered the second most relevant driver of operational risk in the RAQ, at 52% agreement, and ahead of conduct and legal risks (45% agreement). Technology-related risks, but also financial crime, are contributing to a continuously high risk of fraud. Theft or breach of customer credentials, social engineering, online and cyber-fraudulent activities and payment fraud were identified as the main drivers of fraud risk[38].
Supervisory reporting confirms high ICT risks and points to increasing losses at banks in new IT events in 2025. Total materialised losses from newly reported ICT events increased to approximately EUR 0.73 bn in 2025, compared to approximately EUR 0.65 bn in 2024[39]. Total materialised losses as a share of CET1 also increased. At the same time, reported new loss events dropped significantly to approximately 26 000 in 2025, from approximately 46 000 reported in 2024. This indicates materially higher average losses stemming from each newly reported ICT loss event, and points to a growing impact when ICT risks materialise (Figure 39).
Some progress in managing cyber risk
While the overall number of cyberattacks at financial institutions remains high, RAQ responses indicate some levelling of these risks. The responses indicate that the share of banks that had not been a victim of at least one cyberattack in the first half of 2026 has increased[40]. 56% of banks had not been victim of a cyberattack that resulted or could have potentially resulted in a ‘major ICT-related incident’, compared to 49% in the second half of 2025 and 42% in H1 2025. However, the share of banks that had been a victim of 11 or more cyberattacks in H1 2026 increased to 11%, up from 7% in H2 2025. RAQ responses also suggest that the share of responding banks which did not face a cyberattack that resulted in an actual major ICT-related incident increased to 78%, from 71% in the last iteration of the RAQ. These figures indicate that the impact of cyber threats seems contained, and that cyber defence capabilities at banks seem to have improved. In line with levelling cyber risks, the EBA’s follow-up Report on ICT risk assessment under the SREP (Supervisory Review and Evaluation Process) confirms that supervisors and competent authorities have made some progress in strengthening ICT risk assessment[41]. Progress is largely driven by the implementation of the Digital Operational Resilience Act (DORA) requirements, in application since January 2025. Yet the report cautions that further work and continued investment remain necessary to ensure consistent and effective ICT risk supervision across the EU.
Distributed denial of service (DDoS) attacks drive cyber incidences
DORA requires effective management of ICT-related incidents, including their classification, management and dissemination. Since DORA-related incident reporting commenced in January 2025, the EBA has received over 18 000 reports until March 2026[42]. System failures are the dominant category of events reported, particularly for credit institutions (CI). Payment institutions (PI) show a higher exposure to external events (23% vs 18% for credit institutions), while payment and process failures remain evenly distributed between both CIs and PIs (Figure 40). Within reported cybersecurity incidents, DDoS, identity theft and data exfiltration or manipulation are the most common techniques reported by CIs, while PIs most often report an ‘other’ attribution. The European Union Agency for Cybersecurity (ENISA) also identified DDoS attacks as the dominant incident type and accounted for a large majority of reported incidents in the financial sector in 2025[43]. DDoS activity is not least often linked to geopolitical threat actors. Threat actors also use social engineering, increasingly amplified by AI, for cyberattacks, resulting in theft or breaches of customer credentials as a common technique applied for successful cyberattacks, as RAQ results reveal. Data exfiltration and manipulation and supply chain attacks breaches are also being used in successful cyberattacks. ‘Hacktivists’ additionally continue to target banks and cause operational disruptions.
Opportunities from AI at banks are transformative, but substantive risks loom
The banking sector is accelerating its efforts to adopt AI systems, with AI investments increasing. These technologies offer the potential for cost reduction and improved efficiency, and offer benefits across the value chain of banking, such as in operational efficiency and process automation, risk management, financial advisory, customer service and fraud detection. Yet the surge in AI-related investments has increased concentration and interconnectedness, which also affect the financial sector[44]. The use of AI tools likewise poses a range of potential risks, including, operational failures, bias, data quality issues, market risk through algorithmic trading and procyclicality, conduct and legal risk, regulatory uncertainty, enhanced cyberattacks, reliance on third-party providers, and geopolitical risk.
Materialising risks stemming from the use of AI tools could result not only in financial loss and reputational damage but could also have systemic implications. Like other risks, AI risks also require attentive and proactive management going forward. Banks should adopt a risk-sensitive and transparent approach to AI development and deployment that minimises AI risk and is aligned with customer trust and regulatory expectations. This includes establishing adequate and enhanced governance arrangements, efforts to strengthen data security and cyber security, and regular penetration testing for AI systems. DORA requirements for oversight of third-party applications, ICT risk management, incident reporting and resilience testing apply to banks’ use of AI systems. Banks are required to integrate the use of AI tools into their DORA compliance framework and consider any potential AI Act implications.
Highly capable (frontier) AI models pose significant risks
Recent developments of highly capable AI LLMs with vastly enhanced capabilities to discover and exploit software vulnerabilities have raised wide-ranging concerns among banks and supervisors. Relevant authorities, such as the EU Commission’s Computer Emergency Response Team for the EU institutions, bodies and agencies (CERT-EU), caution that the most advanced models could represent a generational jump in autonomous exploiting of vulnerabilities at a pace that fundamentally breaks the traditional patch cycle[45]. They caution that these tools, combined with observable shifts in attacker behaviour, could mark an inflection point in the economics of vulnerability discovery. These models may also enable and fuel cyberattacks with highly advanced sophistication. The tools risk highlighting and exploiting a potentially large volume of ICT vulnerabilities, or even previously unidentified (known as ‘zero-day’) vulnerabilities on major operating systems, at unprecedented speed, making it very difficult for defenders to resolve vulnerabilities at a matching pace. Such highly capable models may not only increase cyber risk but may also amplify a divide between large and smaller banks, with the latter possibly being particularly vulnerable.
In response to significant risks from these models and their fast advances, competent authorities, the EBA and other authorities, are engaging to facilitate information-sharing and to coordinate, facilitate and accelerate necessary responses from financial institutions and supervisors. Close international coordination beyond the EU/EEA to address the challenges is very important. Responses from financial institutions should include efforts to strengthen software quality, including ensuring source code protection, reducing attack surfaces, and responsibly adopting AI-powered security testing. Such AI models might accordingly help banks in addressing cyber risks, although overreliance on them can also add challenges and complexities for banks. Financial institutions should also accelerate the identification and patching process of vulnerabilities and increase the timeliness and frequency of updates and security checks. To improve cyber resilience, it is also important to update business continuity policies and ICT responses, to adapt to faster vulnerability discovery, and not least to elevate responsibilities of the management body.
EU/EEA banks’ profitability stabilises in 2025 before gradually recovering
EU/EEA banks remained profitable, with their weighted average RoE standing at 9.9% based on funding plan data. This level and also wide distribution among banks indicate that EU/EEA banks might at least partially still have challenges in meeting their cost of equity (CoE). Around one third of banks in the RAQ estimated their CoE at between 8% and 10%, and around 40% at around 10% to 12%[46]. Looking forward, according to banks’ funding plans, their RoE is expected to decline by 11 bps in 2026, reaching 9.8%. For later years, banks’ projections signal a clear improvement for their RoE, initiating a gradual upward trajectory to 10.3% in 2027 and 11.2% in 2028 (Figure 41). Whereas revenues are assumed to increase in the forecasted horizon, the reversal of the planned RoE (from a decline in 2026 and a rise in the following years) is largely supported by declining costs. Expectations for return on assets (RoA) from banks broadly mirror the dynamics observed for RoE. RoA is expected to decline slightly from 0.71% (YE2025) by 1 bps in 2026, before recovering thereafter, with successive increases of 5 bps in 2027 and a further 7 bps in 2028. Q1 2026 data show that EU/EEA banks’ RoE remained more or less stable on a yearly and monthly basis. This is not least driven by supportive NIM as well as stable fee income. However, amid strong seasonality of the RoE, this does not yet provide any indications for this year’s overall RoE. The latter will not least strongly depend on how geopolitical developments further evolve.
The backdrop of an expected slight decline in EU/EEA banks’ RoE in 2026 is similarly reflected in the RAQ results. Besides these general sectoral expectations, RAQ results also reflect heterogeneity across banks’ expectations regarding their profitability for this year. Results from the RAQ indicate a relationship between bank size and RoE expectations. In particular, 55% of large banks responded positively when asked whether they expect an overall increase in RoE over the next 6 to 12 months, compared with 27% of small and medium-sized banks. This is a result that has only rarely been observed in recent periods. Conversely, most small and medium-sized banks (73%) reported that they do not or probably do not expect an increase in RoE over the same horizon, marking the highest level recorded for this bank category since 2021 (Figure 42). This size‑related divergence translates into more favourable RoE expectations for large banks, which might reflect stronger diversification and economies of scale. As highlighted in the RAR in autumn 2024, such size-related differences might be linked to divergences in banks’ business models. Larger institutions might, for instance, be better positioned to absorb shocks amid their diversified income sources. By contrast, small and medium-sized banks appear more constrained in this respect, weighing on their expected RoE. Q1 data show that smaller and mid-sized banks’ RoE declined remarkably, whereas the RoE for larger institutions increased, which would indicatively confirm the RAQ expectations.
Banks reinforce their revenue base as net operating income rests on interest income
According to EU/EEA banks’ funding plans, net operating income as a share of equity only rises slowly, increasing from around 32.5% of equity in 2025 to close to 33% by 2028. This evolution is anchored in the sustained strength of NII, which remains the backbone of banks’ earnings capacity and rises steadily from about 18.7% of equity in 2025 and 2026 to around 18.9% in 2027, and approximately 19.1% by 2028 (Figure 44). The rise in NII over the forecast horizon is, on the one hand, driven by a further increase in loan volumes (Figure 13). The improvement in NII is, on the other hand, also supported by a rising NIM in 2027 and 2028 (Figure 43). Based on EU/EEA banks’ funding plans, their NIM shows a moderate correction of 1 bp (reaching 1.55%) in 2026 before reversing in 2027 and resuming a stable upward trend, reaching 1.63% in 2028. The NIM in Q1 even increased slightly, which is better than its previously expected evolution for this year, and confirming that it has bottomed out. The data also confirms a further increase in debt securities exposures which may not least indicate a rising use of replication portfolios that could further support NII going forward.
Beyond interest income, the remaining revenue base shows limited dynamism but provides a degree of stability: non‑interest revenues continue to account for roughly 13.5-14.0% as share of equity over the forecasted horizon, with fee‑related income broadly stable at around 9.5-9.6%, and market‑related income contained at just above 2%. Meanwhile, residual operating income declines slightly from about 2.1% to below 2.0% as share of equity, reinforcing a revenue profile driven more by the real core drivers and less by the more unpredictable parts (Figure 44). Overall, the improvement in net operating income appears modest but rather reasonable, reflecting an outlook that is supported primarily by the durability of core revenues rather than by a shift toward more volatile income sources.
The end of the rate cut cycle supports NII
Funding plan data show that the stabilisation of NII reflects the fading impact of the interest rate cut cycle. The end of the interest rate cut cycle seems to allow banks to stabilise pricing conditions across both lending and deposit curves, supporting expectations of more resilient NIMs. Related to loan pricing, rates for both households and general governments are expected to stay almost unchanged this year, after having seen more pronounced declines last year (-11 bps last year for households, -32 bps last year for general governments). NFC loan rates are expected to decline by around 12 bps this year, after 66 bps last year[47]. The assumed rate reductions are more pronounced on the deposit side. For household deposits, the contraction in rates is 8 bps this year after 26 bps last year, and 12 bps for NFC deposits, after 60 bps last year (Figure 45). Overall, these developments point to a more stabilised loan and deposit pricing environment, supporting NII as repricing effects progressively unwind. However, it must be noted that the latest developments in the yield and rate environment not least indicate renewed interest rates rising going forward. It also means that banks need to be prepared for such sudden moves. EU/EEA banks’ interest rate risk in the banking book (IRRBB) data indicates that the overall NII impact of a parallel move up of the rate curve should be positive (see separate box on IRRBB-related analysis). However, particularly if such moves happen quickly or are, for instance, not a simple parallel move but also certain ‘twists’ of the rate curve, it can become more challenging.
Box 4: Implications of the current macroeconomic environment on EU/EEA banks’ interest rate riskThe macroeconomic environment prevailing in early 2026 has again increased the relevance of IRRBB as a supervisory concern. Following the aggressive monetary tightening cycle of 2022–2023, followed by rate cuts in many jurisdictions, rate expectations had begun to stabilise. However, the assumed further trajectory has been disrupted. A confluence of factors – including newly rising inflation and heightened uncertainty around global trade policy – has driven an upward repricing of rates across major jurisdictions. In this context, a stylised parallel upward shift of 200 bps in the risk-free yield curve provides some indications for the resilience of EU/EEA banks’ balance sheets and the adequacy of their hedging strategies. Under a +200bps parallel shift, the EVE sensitivity across the EU/EEA banking sector points to a meaningful, but heterogeneous, trajectory. Based on Q4 2025 data, the weighted average EVE impact as a share of Tier 1 capital stood at approximately -7%, with several institutions close to the outlier threshold of 15%. The EVE metric is particularly sensitive to the maturity profile and repricing behaviour of banks’ fixed-rate asset portfolios. Institutions with presumably large holdings of long-duration sovereign bonds or, for example, fixed-rate mortgage books – notably prevalent in Italy, Poland and Croatia – register the highest adverse EVE impacts under an upward shock (on average around -10%). The distribution of EVE outcomes across jurisdictions underscores that aggregate EU/EEA-level figures mask substantial dispersion, and that supervisory assessments remain paramount (Figure 46). The NII in the parallel shock scenario shows that a rate increase of +200bps would be expected to benefit institutions with, for instance, predominantly floating-rate asset books and sticky deposit bases, as asset yields reprice faster than funding costs in such cases. Across the EU/EEA, aggregate NII sensitivity to a +200bps parallel shift is around +0.5% over a 1-year horizon. However, this average figure conceals an important heterogeneity. For institutions that had, for instance, locked in fixed-rate income, the NII benefit from a renewed rate increase is limited or even negative in the near term, as higher funding costs might materialise before fixed-rate books reprice. Nevertheless, the experience of the rate cycle of 2022–2023 showed how strongly model assumptions and their outcomes depend on deposit repricing, which is highly unpredictable. Figure 46: NII and EVE impact as % of Tier 1 capital by bank (Dec-22 and Dec-25; red marks are EU/EEA average for respective years)Source: EBA supervisory reporting data The supervisory picture is presumably further complicated by the evolution of banks’ hedging strategies since the 2022–2023 tightening episode. EBA supervisory reporting data suggests that the aggregate notional of interest rate derivatives used for IRRBB hedging has increased by more than 10% since 2022. Banks’ possible repositioning has reduced near-term NII volatility, and at the same time has resulted in adverse EVE outcomes under upward rate shocks, as IRRBB data shows. Banks and supervisors should also remain attentive to the risk that hedging structures conceived under one rate scenario may perform poorly under a different shock configuration. Business model heterogeneity across the EU/EEA banking sector also implies divergent rate sensitivity profiles. Savings and cooperative banks – which represent a significant share of intermediation in some countries such as Germany, Austria and France – tend to carry higher fixed-rate asset concentrations and more stable but slower repricing deposit bases, resulting in adverse EVE sensitivity that is structurally more pronounced than for other peers. At the other end of the spectrum, banks operating predominantly in variable-rate mortgage markets – notably in Spain, Portugal or Finland – demonstrate stronger NII resilience but may face asset quality pressures if sustained rate increases erode borrower debt service capacity. The supervisory outlier framework provides a basis for flagging institutions where IRRBB-related impacts are disproportionate relative to capital. However, it also needs to be stressed that the parallel shock scenarios and the other four IRRBB supervisory predefined scenarios might not fully capture the risks that may emerge under more complex moves of rate curves. Competent authorities would for this reason need to complement the available IRRBB analyses with further analysis, depending on how rate moves and so on are expected to evolve, and banks’ interest rate positioning and management, their hedging, and the structural features of the markets in which they operate. |
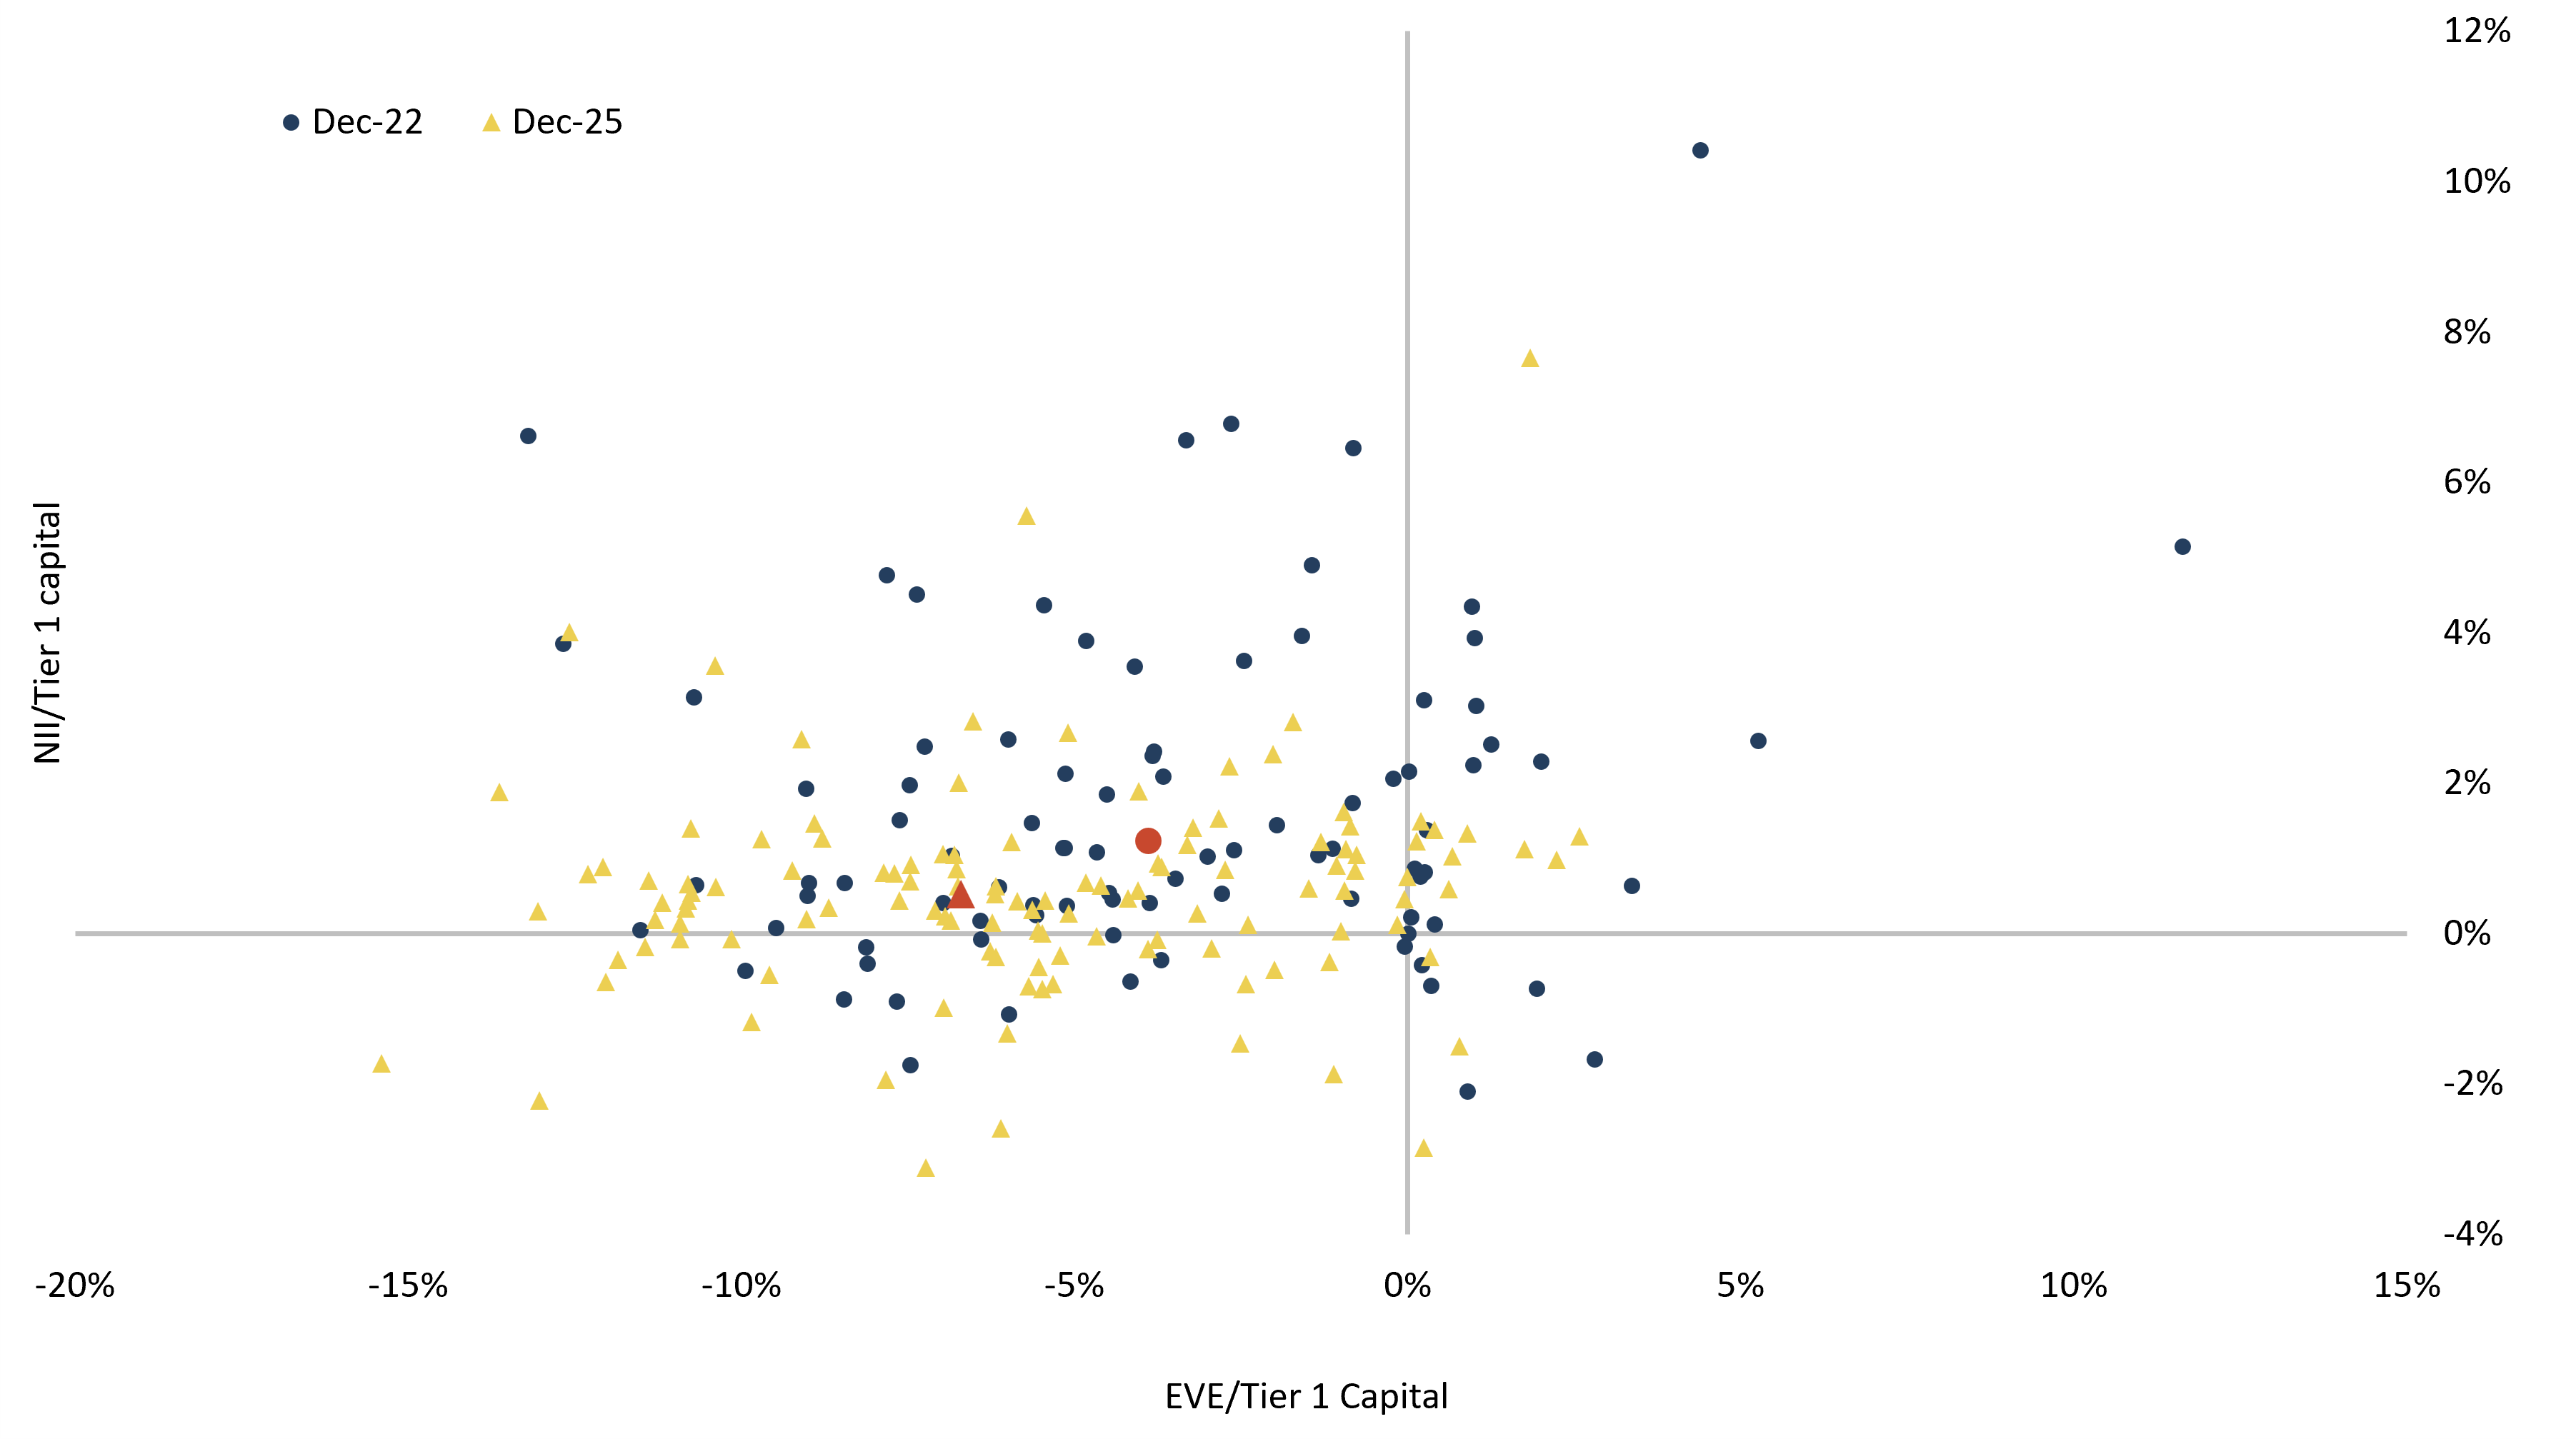
Banks’ costs tend to decline amid efficient management of administrative expenses
EU/EEA banks’ expenses stood at 22.5% of equity in 2025, representing a decline of 210 bps compared with 2024 funding plan data and confirming the downward trend in costs that emerged in the EU/EEA banking sector last year. Staff expenses and other administrative expenses represent the majority of banks’ costs, amounting to 9.9% and 7.4% of total equity respectively, while impairments represent 2.4% of total equity, provisions 0.5% and other expenses 2.3%. Banks’ projections, as reflected in their funding plans, expect a slight increase in costs that will amount to 22.7% of total equity in 2026, mainly driven by a progression of other expenses, including tax and income from discontinued operations. For the next few years, banks’ funding plans assume a more general cost relief for EU/EEA banks, with expenses expected to experience an initial drop to 22.4% of total equity in 2027, passing below the 2025 historical level and then further decreasing to 21.8% in 2028. A key driver for this reduction is a gradual reduction in staff expenses and other administrative expenses, which contribute 23 bps and 21 bps respectively, to the overall decline in banks’ expenses in 2027. This cost reduction is even more pronounced in 2028, with staff expenses decreasing by 36 bps and other administrative expenses by 29 bps (Figure 47).
While a reduction in personnel costs could be plausible, for instance reflecting efficiency gains from automation and also previously seen trends, it could also generate some indirect savings on premises costs, as smaller workforces may require less office space and lower related rents. However, the parallel decline assumed for other administrative expenses dropping by around 50 bps from 2026 to 2028 might be challenging to justify. This is not least the case because ICT‑related costs represent the largest share of other administrative expenses, accounting for 32.1% in 2025, up from 31.2% in 2024 (Figure 48). These costs might not be in a declining stage, but rather rising further, amid the need for further ICT investments. Rapid advances in technologies such as AI or quantum computing, as well as evolving cyber and other ICT‑related risks, are likely to require additional investment not only in the short term, but also over the medium and long-term. It must be additionally noted that these investments might not least be particularly challenging for smaller and maybe even medium-sized institutions. Taking the current composition of ICT expenses, according to the latest RAQ, 72% of banks identify core banking and payment-related systems as a major source of ICT expenditure (Figure 49).
These costs will hardly disappear in the short-term but might rather increase if old systems need to be replaced, for instance. Furthermore, if old or existing systems stay in place, it is not clear how spending related to them might decline, not least assuming that ageing systems rather require higher spending, not least amid the quickly evolving ICT-related risk landscape. RAQ data also show that spending is significant in customer-facing digital channels/online banking, as well as ICT/cyber/data security, which is primarily driven by investments in new systems (Figure 49)[48]. Overall, ICT costs reflect ongoing needs to maintain legacy infrastructure while supporting digitalisation and resilience efforts. Given the large and increasing weight of ICT expenses within administrative costs, the assumption of declining administrative expenses appears particularly optimistic. Another risk for operational expenses stems from inflation. If inflation stays higher for longer, this could also have negative impact on banks’ expenses.
Based on latest funding plan data, when keeping expenses constant in 2027 and 2028 (as a share of equity), i.e. “deleting” the profitability gains from the assumed cost savings over the years 2027 and 2028 (i.e. staff expenses and other admin expenses), the RoE would be around 9.9% in 2027 (instead of 10.3%), i.e. nearly the same as it is planned for 2026, and would be 10.1% and not 11.2% in 2028. This is a very simplified calculation and not the expectation, but indicates the impact the assumed cost savings have. It can also be pointed out, for instance, that the rise in rates – which had not been basis for the submitted funding plan data – might improve NII expectations, which would positively affect the forecasted RoE, as shown in the separate IRRBB based analysis (see textbox on the IRRBB analysis). At the same time, a possible deterioration in the economic outlook might result in a higher cost of risk, which would then have a negative impact. Q1 2026 data indicate a modest increase in the cost of risk. However, this development does not, at this stage, point to a broad-based deterioration in asset quality and may partly reflect seasonal first-quarter effects and a prudent build-up of provision overlays amid heightened uncertainty.
Box 5: Trends in EU/EEA banking sector mergers and acquisitions (M&A)The value of M&A transactions in the EU/EEA banking sector surged sharply in year 2025. This was despite the continued trend of a decreasing number of transactions and marked a break from previous years. The pronounced spike is largely driven by the completion of several rather large in size transactions, which significantly raised aggregate deal volumes. The preference for domestic M&A transactions persisted into 2025. Domestic M&As accounted for the majority of deals and transaction value, while EEA deals played a secondary role and non‑EEA transactions were limited. However, the latter have gained some ground in 2026 YtD, outweighing EEA deals (Figure 50)[49]. Looking forward, RAQ results indicate that the share of banks not interested in M&A has increased, but still remains below 50% (i.e. the majority of banks is still interested in M&A). The implicit decline might not least be due to the actual transactions closed now. This would be because banks might instead digest past transactions rather than heading for immediate further M&A, even though there are also some banks being constantly engaged in deal making. The rise of the share not being interested in M&A might also be explained by heightened macroeconomic uncertainty as well as valuations effects as banks have been outperforming the market for some time now. Among those banks interested in M&A, the share of those being in EEA transactions is the highest, also having again increased a bit further. Banks’ considerations regarding M&A deals with domestic CIs declined in the recent RAQ. (Figure 51) |
6.Capital
EU/EEA banks’ capitalisation remained near record high levels, not least driven by the strong organic capital creation of the sector. The total capital ratio reached 20.4% as of Q4 2025, which is a YoY increase of 10 bps. This was due to the CET1 component, which rose by 10 bps to 16.3%[50]. AT1 at 1.4% and Tier 2 at 2.6% of total RWA were unchanged YoY. EU/EEA banks’ leverage ratio remained broadly stable, reaching 5.9% as at Q4 2025. The volume of CET1 capital rose by EUR 41 bn (+2.5%) to EUR 1.67 tn. The increase was mainly due to increasing retained earnings of EUR 66 bn to EUR 1 tn (see Chapter 5 on banks’ profitability). The increase in CET1 capital was partly offset by increasing goodwill (increasing by EUR 12.9 bn to EUR 89 bn) and a rise in other deductions, as well as minority interests and adjustments (increase by ca. EUR 11.7 bn to EUR 209.5bn), which banks are required to deduct from CET1 capital. In summary, these deductions increased by EUR 24.6 bn (8.9%) compared to last year (Figure 52). Based on Q1 2026 data, the CET1 ratio declined, on average, not least due to rising credit and market RWAs.
Stable capital headroom above requirements
EU/EEA banks’ CET1 headroom above respective OCR plus P2G has hardly changed compared to last year, and stood at 4.8% in Q4 2025[51]. This is a result of a higher CET1 ratio (+10 bps), which was offset by an increase in the combined buffer requirement (+13 bps) and decreased by Pillar 2 requirement (P2R) and P2G with a total of 3 bps in the last year (Figure 53).
Combined buffer requirements were driven by an increase in institution-specific countercyclical capital buffers (CCyB), which increased by on average 8 bps YoY and stood at 0.82% of total RWA. The CCyB is likely to continue to rise further this year, since several CCyB changes due to become effective this year have been announced[52]. The systemic risk buffer (SyRB) increased by 5 bps and stood at 0.30% of total RWA. The buffer for systemically important institutions, which represents for each bank the higher of either the other systemically important institution buffer (OSII buffer) or the global systemically important institution buffer (GSII buffer), remained stable at 1.11% of total RWA. The capital conservation buffer is fixed at 2.5% of total RWA as per CRD VI rules (Figure 54).
CET1 ratios and their related requirements continued to exhibit significant cross-country dispersion last year. As at Q4 2025, OCR plus P2G ranged from 9.6% for banks in Luxembourg and up to 16.7% for banks in Norway. CET1 ratios for Q4 2025 ranged from 13.3% for banks in Spain to 26.8% for banks in Cyprus. Compared to end-of-year 2024 data, 21 countries showed a higher capital headroom, with Luxembourg and Cyprus having the highest CET1 ratios and headroom. Norway (1%), Spain (3.1%), Denmark (3.1%), and Greece (4%) reported the lowest capital headroom above OCR &P2G (Figure 55). There is also wide dispersion of the headroom among banks. While the majority of EU/EEA banks report capital headroom at comfortable levels, there are still some banks that have a rather narrow capital headroom, which could potentially impede their ability to weather challenging developments in the macroenvironment.
Payouts increase further, supported by robust profitability
Solid capital buffers and constant profitability helped EU/EEA banks to distribute record dividend payments and share buy-backs in 2025 (together referred to as ‘payouts’) of EUR 106 bn, representing a stable payout ratio of 54% based on year-end 2024 profits. This is 7% higher than the year before (EUR 99 bn), and also exceeds the originally planned payout ratio of 50%. Banks’ plans for the year 2026 indicate a further rise with planned payouts, reaching around EUR 117 bn. The planned payouts based on banks’ annual results for 2025 would correspond to a further increased payout ratio of 57% (Figure 56)[53].
7.Considerations on measures to address key risks & vulnerabilities
EU/EEA banks remain a cornerstone to keep the economy running amid the materialisation of geopolitical risks. EBA stress test results in 2025 have shown that EU/EEA banks are prepared for weathering a geopolitically challenging environment. It remains important that banks continue lending to the economy, accompanied by proper management of credit risk and ensuring that underlying lending standards remain prudent. EU/EEA banks also need to proactively address geopolitical risks[54].
Proper management of credit risk concerns household and NFC lending, but also interlinkages with NBFIs, especially private credit. As exposures to NBFIs grow, banks should be able to implement risk identification and monitoring, identify and assess the creditworthiness of underlying counterparties and correlated exposures, run scenario-based simulations on exposures across business lines, and improve potential opacity in their data-aggregated exposures across obligors and products. Banks should maintain robust internal valuation governance and capabilities to effectively monitor, review and challenge collateral valuations, including where valuations are performed by qualified independent valuer or supported by valuation models.
Strengthen risk management for energy price/geopolitical shocks. Second-round effects resulting from the conflict in the Middle East presumably primarily affect energy-intensive sectors but can additionally have an impact on other sectors such as hospitality and agriculture. Banks and supervisors should perform granular sectoral scenario analysis and/or stress testing, tighter monitoring of possible pockets of risks, particularly in SMEs, consumer and CRE exposures, and proactively apply measures such as restructuring and early-warning indicators as soon as challenges appear. For real estate exposures, and in particular CRE, monitoring should not least remain sufficiently granular to reflect national market specificities, differences in property type, loan to value levels and, where relevant, income producing vs. non-income producing real estate characteristics.
Amid volatile funding markets, banks need to ensure they keep a healthy funding mix and that funding plans remain credible under stress. This includes issuances of market-based funding in times of less volatility. Banks and supervisors should continue assessing whether banks’ liquidity and funding plans sufficiently account for the risk of abrupt repricing dynamics in deposit markets if banks further increase their deposit base, including potential spiral effects on funding costs. Not least amid high geopolitical risks, proper management of FX-related risks – including FX funding – remains important. It is also important to ensure that banks have sufficient collateral – encumberable assets – available that they can use for funding purposes, but also for margin calls in case of elevated market volatility.
Recent developments of highly capable (frontier) AI LLMs have brought cyber risks even further to the fore. AI needs to be considered as a material risk amplifier. Banks need to constantly and proactively keep addressing any new forms of ICT and cyber risks and stay on high alert in this respect, including already now addressing risks related to expected future use of quantum cryptography[55]. This also requires constant investment. Smaller and mid-sized institutions need to ensure they stay up to date in this respect. Not least related to ICT, but also payments, banks also need to proactively address and manage non-EU/EEA dependencies.
Analysis shows that EU/EEA banks have made progress in addressing climate risks. Going forward, they need to continue enhancing practices in a consistent manner, including through the development of robust transition planning.
Maintain strong capital buffers, preserve distribution flexibility and ensure continuous proper interest rate hedging. Given elevated geopolitical and market volatility and uncertainty, banks should continue with prudent capital planning and ensure that they are able to reduce payouts quickly in case their capital positions deteriorate faster than expected. At the same time, it is important to have in mind that banks’ payouts are an important tool for keeping the EU/EEA banking sector an attractive investment for investors. Banks also need to be prepared for sudden moves in interest rates, especially if they happen abruptly. Banks and supervisors should also remain attentive to the risk that hedging structures conceived under existing rate scenarios may perform poorly under a different shock configuration.
To support EU/EEA banks’ capital positions, banks also need to ensure healthy profitability levels and organic capital generation. This includes a proper revenue mix as well as cost control and management of interest rate risks. M&A might be one means of addressing profitability-related challenges, on the revenue as well as the cost side.
List of figures
Figure 1: Forward Brent crude oil & TTF gas prices
Figure 2: EA inflation rate (left) and Euribor rates (right)
Figure 3: EURO STOXX 50 Volatility Index (V2TX) (left) and YtD % change in prices of selected stock indices (percentage points) (right)
Figure 4: Evolution of selected 10-yr European sovereign yields (left) and yield curve for European banks and its history (right)
Figure 5: CDS spreads for EU/EEA bank senior and subordinated debt
Figure 6: Overall adoption of climate risk targets across regions
Figure 7: Adoption of fossil fuel restriction-related target
Figure 8: Expectation on climate-related sustainability targets
Figure 9: Overall development of climate-related implementation actions
Figure 10: EU/EEA banks’ loan book annual growth by segment
Figure 11: Historical short-term rolling volatility of selected EURO STOXX Equity Indices (left), historical short-term rolling beta – selected equity indices vs oil prices (right)
Figure 12: EU/EEA banks’ accounting classification of sovereign exposures (left) and evolution of unrealised losses on amortised cost bond portfolios (right)
Figure 13: EU/EEA banks’ expected asset growth by segment, 2026–2028
Figure 14: Banks’ projections on annual growth in lending towards households, by country
Figure 15: Banks’ projections on annual growth in lending towards non-financial corporations, by country
Figure 16: Share of EU/EEA banks planning to increase lending volumes by portfolio
Figure 17: Domestic vs cross-border lending growth outlook – Households (left) and NFC (right)
Figure 18: EU/EEA banks’ NPL ratios expectations
Figure 19: EU/EEA banks’ projections on growth of NPLs by segment and country
Figure 20: Share of EU/EEA banks expecting a deterioration in asset quality by portfolio in the next 12 months
Figure 21: Development of S&P BDC Index (lhs) and S&P 500 index (rhs), over time (left), and indexed share prices (Jan 2021 = 100) of major alternative asset managers and S&P 500 index, over time (right)
Figure 22: EU banks’ exposures towards asset managers engaged in private credit activities, EUR bn (left) and distribution of exposures by country of domicile of the counterparty (right)
Figure 23: EU/EEA banks’ full year (left) and 1 January to 30 April (right) debt and capital instrument issuances per year (EUR bn, bars), and share of green bonds (rhs)
Figure 24: Cash asset swap (ASW) spreads of banks’ EUR-denominated debt and capital instruments (in bps)
Figure 25: Funding composition of EU/EEA banks (EUR tn)
Figure 26: Unsecured debt issuance and maturing volumes (EUR bn)
Figure 27: Unsecured debt instruments – stock volume (EUR bn)
Figure 28: Secured debt issuance, maturing and retained volumes (EUR bn)
Figure 29: EU/EEA banks’ issuance volumes, covered bonds vs unsecured/subordinate bond placements, per year and for selected stress/crisis months (left) and ASW spread differentials vs covered bonds, by seniority, over time (right)
Figure 30: Forecasted LCR (left) and NSFR (right, both in %), including forecasted numerators and denominators (EUR tn)
Figure 31: Composition of FX liabilities, main components (left); USD funding gap/overhang – 2025 (actual, x-axis) vs 2028 (y-axis) in EUR bn (right)
Figure 32: YoY evolution of the asset encumbrance ratio (lhs), and numerator (encumbered assets) and denominator trends (total assets) (rhs, YE 2014 = 100)
Figure 33: Evolution of the weighted average asset encumbrance ratio by country, between December 2024 and December 2025
Figure 34: Evolution of the share of the key instruments used for encumbrance (%) and total volume in EUR tn, from December 2018 to December 2025
Figure 35: Non-encumbered assets amounts (EUR tn) and share of non-encumbered assets to total assets from December 2024 to December 2025
Figure 36: Distribution of the reasons for encumbrance (%)
Figure 37: Risks or challenges related to dependencies on non-EU/EEA service providers and whether actions have been taken
Figure 38: Main drivers of operational risk as seen by banks
Figure 39: Number of new IT risk events over time and total losses in operational risk as a share of CET1
Figure 40: Reporting of ICT-related incidents under DORA incident reporting according to incident type reported to the EBA, January 2025–March 2026
Figure 41: RoE and contribution of the main P&L items (as share of equity) to the RoE’s YoY change, comparison between December 2025 and projections for 2026, 2027 and 2028 (%)
Figure 42: Banks’ expectation of an overall increase in RoE, by dimension
Figure 43: EU/EEA banks’ NIM
Figure 44: Projections for income and its components as % of equity, EU/EEA level
Figure 45: Interest rates on loans (left) and deposits (right) by segment
Figure 46: NII and EVE impact as % of Tier 1 capital by bank (Dec-22 and Dec-25; red marks are EU/EEA average for respective years)
Figure 47: EU/EEA banks’ projections of key components of costs and expenses as % of equity
Figure 48: Breakdown of administrative expenses, EU/EEA level
Figure 49: ICT costs for new vs legacy systems and key expenditure areas, EU/EEA level
Figure 50: EU/EEA banking sector-related completed M&A transactions since 2023, number and volume in EUR bn
Figure 51: M&A measures considered by EU/EEA banks
Figure 52: Capital ratios and leverage ratios (%) (left) and CET1 components (EUR bn) (right)
Figure 53: Capital ratios and leverage ratios (%) (left) and CET1 components (EUR bn) (right)
Figure 54: Figure 54: Combined buffer requirements (%)
Figure 55: CET1 requirements, P2G and CET1 ratio by country (Q4 2025 in %)
Figure 56: Dividend and share buy-backs (in EUR bn; lhs) and payout ratio (%) (rhs)
Abbreviations
Annex 1: Sources of and basis for data and analysis
This report describes the main developments and trends in the EU/EEA banking sector and provides the EBA outlook on the related main risks and vulnerabilities[56]. The RAR is based on qualitative and quantitative information collected by the EBA. The report’s key data sources are the following:
- EU/EEA supervisory reporting[57];
- the EBA RAQ addressed to banks;
- market intelligence, as well as qualitative micro-prudential information.
This report follows the common structure of the EBA’s RARs. The RAR builds on the supervisory reporting data that competent authorities submit to the EBA on a quarterly basis, for a sample of 161 banks from 30 EEA countries (129 banks at the highest EU/EEA level of consolidation from 26 countries)[58]. Based on total assets, the sample covers more than 80% of the EU/EEA banking sector. In general, the risk indicators and other supervisory reporting-based charts and analysis are based on an unbalanced sample of banks, whereas charts related to the risk indicator numerator and denominator trends are based on a balanced sample[59]. When referring to countries, the respective data are based on the sample of banks applicable for this jurisdiction (see Annex II), if not otherwise stated. The text and figures in this report refer to weighted average ratios unless otherwise indicated[60]. In selected cases, some of the analysis covered in this RAR is based on data from other reporting and data submissions, such as the EBA’s DORA incident reporting[61].
The RAQ is conducted by the EBA on a semi-annual basis, with one questionnaire addressed to banks[62]. Answers to the questionnaires were provided by 85 European banks (Annex II) during February and March 2026. The report also analyses information gathered by the EBA from informal discussions as part of the regular risk assessments and ongoing dialogue on the risks and vulnerabilities of the EU/EEA banking sector. The cut-off date for the market data presented in the RAR was 31 May 2026, unless otherwise indicated.
Annex 2: Sample of banks
List of banks that made up the sample population for supervisory reporting and the RAQ[63]:
Documents
Links
[1] This RAR was prepared by and/or includes contributions from Achilleas Nicolaou, Aleksandra Potterie, Anastasiya Yushkevich, Andreas Pfeil, Angel Monzon, Christoph Kuhn, Damiano Marcotti, Fabien Le Tennier, Friedrich John, Gaetano Chionsini, Jorge Pinto, Kamil Liberadzki, Maria Rocamora, Mathis Meyer, Matteo Barbieri, Michele Graziano, Mira Lamriben, Priscilla Gaibini, Raphael Kopp, Salvatore Corvasce.
[2] See International Monetary Fund, World Economic Outlook, April 2026.
[4] See BIS: Financing the AI boom: from cash flows to debt, January 2026.
[5] See, for instance, the BIS article on ‘Private credit’s software lending meets AI disruption’, March 2027, or S&P Global’s ‘BDCs’ Exposure To Software […]’ , March 2027.
[6] See the FSB’s ‘Report on Vulnerabilities In Private Credit’, May 2026.
[7] The analysis is based on the data and indicators made available by the CPI in its Net Zero Finance Tracker, which combines data from 58 sources to assess financial institutions’ practices across three dimensions (impacts, implementation, targets). It also tracks whether institutions have adopted a transition plan. Each indicator is associated with a standard set of actions measuring the degree of maturity of institutions’ practices. See also CPI (2025), Tracking the Transition: Global private financial institutions’ progress toward net zero and Climate Policy Initiative (2025), Net Zero Finance Tracker Methodology 2025.
[8] See, for example, Banks have made good progress in managing climate and nature risks – and must continue by Frank Elderson, Member of the Executive Board of the ECB and Vice-Chair of the Supervisory Board of the ECB.
[9] See, for instance, the EBA’s Guidelines on ESG risk management and the Guidelines on environmental scenario analysis.
[10] These countries include countries of the Gulf Cooperation Council (GCC) and other Middle East countries (Iran, Iraq, Israel, Jordan and Lebanon).
[11] Including the STOXX Europe 600, STOXX Europe 600 Banks, STOXX Europe 600 Oil&Gas, STOXX Europe 600 Utilities, STOXX Europe 600 Chemicals, STOXX Europe 600 Construction & Materials, and STOXX Europe 600 Healthcare (see Guide to Industry Classifications used by STOXX LTD.). Rolling volatility is computed as a time-varying measure of return variability. Specifically, at each point in time it is defined as the standard deviation of daily returns over a 21-trading-day backward-looking window.
[12] The rolling beta is computed as a time-varying measure of co-movement between sectoral equity returns and oil price returns. Specifically, at each point in time, it is defined as the ratio of the rolling covariance between daily index returns and daily oil returns to the rolling variance of oil returns. This is estimated over a 21-trading-day rolling window, allowing for a high-frequency assessment of how sectoral sensitivities to energy price movements evolve over time and across regimes.
[13] Data as of June 2025, as analysis is based on ESG disclosures collected by the EBA. See also the EBA’s ESG dashboard.
[14] Mining and quarrying (NACE B), selected sub-sectors of manufacturing (NACE C), electricity, gas, steam and air conditioning supply (NACE D) and transportation and storage (NACE H).
[15] Sovereign exposures refer to on-balance sheet exposures (loans and debt securities).
[17] See IMF’s Global Financial Stability Report (GFSR), Chapter 2: ‘The Rise and Risks of Private Credit’, April 2024.
[18] The NPL ratio based on funding plan data is a simplified calculation, amid available/reported data. It is based on net book values and not on gross book values, as is the case for the NPL ratio based on FINREP and, for example, shown in the EBA’s quarterly Risk Dashboard.
[20] Global private credit assets under management are estimated at around USD 2 trillion, having grown roughly ten-fold since the global financial crisis. European private credit assets have also grown strongly, reaching around EUR 0.43 trillion in 2024, which is about three times their 2014 level. Growth has averaged around 20% annually over the past 5 years, with broadly similar dynamics observed in the United States, Europe, and Asia (see IMF Global Financial Stability Report (April 2024); Buch Hidden Leverage and Blind Spots: Addressing Banks’ Exposures to Private Market Funds (June 2025)).
[21] These investment managers oversee conventional portfolios of stocks and bonds for individuals or asset owners, excluding hedge funds, venture capital, private equity managers, insurance companies, pension funds, and endowments which form separate investor categories.
[22] According to the Draghi Report on the future of European competitiveness (2024), annual investment needs exceed EUR 800 bn.
[23] See for instance the FSB’s “Report on vulnerabilities in private credit” from May 2026 and the ECB’s coverage of the topic of stress in global private credit markets and its implications for euro area financial stability in the Financial Stability Review from May 2026.
[24] It should be stressed that the reported figures only provide an indicative measure of exposures related to private credit activities, as they capture exposures to respective investment funds and asset managers engaged more broadly in such activities, while excluding those below the large exposure reporting threshold.
[25] See the EBA’s Risk Assessment Questionnaire, spring 2025 and autumn 2025 editions.
[28] Banks’ historical funding mix and the dispersion of the funding mix among countries – with e.g. higher relevance of covered bond and lower relevance of deposits among Nordic countries – are, for instance, covered in the Autumn 2025 edition of the EBA’s Risk Assessment Report published in November 2025, and in the Annex of the EBA’s quarterly Risk Dashboard.
[29] It should be noted that repos are a separately reported line item in funding plan reporting, which also includes NBFI exposures and others.
[31] Funding Plan data provide a 1-year forecast for the LCR.
[32] Banks report FX positions in the two largest significant currencies and in their reporting currency. For this purpose, a currency is considered significant where it accounts for more than 5% of total liabilities. The data shall be reported without considering the hedging effect from FX forwards, FX swaps, cross-currency swaps or other instruments. Analysed funding positions might be further affected by derivative and other measures that are not part of the respective reporting.
[33] See on FX funding also the EBA’s Report on EU/EEA banks’ funding structure from November 2025.
[35] Differences in total assets to data in Chapter 2 are due to a different reporting template and slightly differing sample of reporting banks for asset encumbrance data.
[36] On operational risk, as a driver for the rise in RWA in 2025, see also the last RAR edition on (Chapter 4 on capital and risk-weighted assets).
[38] The EBA published two factsheets designed to help consumers protect from crypto and other online frauds and scams. Jointly with the ESAs, the EBA also published a report on payment fraud, outlining that, despite the presence of strong authentication measures, fraudsters are adapting accordingly.
[39] Gross loss amount from new ICT risk events and loss adjustments relating to previous reporting periods.
[40] ‘Cyberattack’ relates to an ICT-related incident with a potentially high adverse impact on the network and information systems that support the critical functions of the financial entity (Article 3(8) of DORA).
[41] See the follow up Peer Review Report on ICT Risk Assessment under SREP, February 2026. The exercise reviewed the recommendations issued to competent authorities in 2022. It assessed progress in light of the application of DORA, and the forthcoming integration of the ICT SREP Guidelines into the revised SREP Guidelines
[42] There are three different types of reports (initial, intermediate, and final and reclassification as non-major); note that each incident may have multiple intermediate reports, while 5% of all reported incidents were reclassified as non-major.
[43] See the ENISA Threat Landscape 2025, October 2025.
[45] See CERT-EU ‘AI is changing the economics of vulnerability discovery’, April 2026.
[46] On further RoE analysis, including its distribution, see the EBA’s quarterly Risk Dashboard.
[47] Interest rate forecasts are reported for only one forecasted year.
[48] These two cost areas have – besides core banking/payment systems – the highest share when asked about the top three contributors related to ICT costs.
[49] It must be noted that the data for 2026 also include announced deals to reflect on deal activity. Completed deals are rather small in number during the first months of the year. Data for previous years include completed deals only. Data as of April 2026.
[50] CET1 ratio as per applicable transitional arrangements specified in the CRR.
[51] OCR equals Pillar 1, Pillar 2 and the combined buffer requirements (CBR). It must be noted that the capital headroom-related analysis is expressed in terms of CET1. It needs to be noted that AT1/T2 shortfalls, which must be absorbed by CET1 capital, are not considered in the CET1 headroom and related analysis.
[53] The planned payouts include at least parts of interim dividends, i.e. if banks pay interim dividends throughout the year these might not be fully considered in perspective planned payouts. Share buyback plans might also change during the course of the year or might last for a longer period, e.g. exceeding the end of the year.
[54] See the previous RAR edition, which has geopolitical risks and related measures as a focus topic.
[55] See also ‘What organisations should do now’ in CERT-EU’s ‘AI is changing the economics of vulnerability discovery’, April 2026.
[56] With this report, the EBA discharges its responsibility to monitor and assess market developments and provides information to other EU institutions and the general public, pursuant to Regulation (EU) No 1093/2010 of the European Parliament and of the Council of 24 November 2010 establishing a European Supervisory Authority (European Banking Authority), and amended by Regulation (EU) No 1022/2013 of the European Parliament and of the Council of 22 October 2013. With the analysis in this report, the EBA discharges its responsibility to coordinate the assessment of funding plans at Union level, including credit institutions’ plans to reduce reliance on public sector funding sources, and to assess the viability of such plans for the Union banking system, on an aggregated basis, as set out in Recommendation A of the ESRB recommendation on funding of credit institutions from 20 December 2012 (ESRB/2012/2). With this analysis, the EBA also discharges its responsibility to closely monitor the level, evolution and types of asset encumbrance as well as unencumbered but encumberable assets at Union level, as described in Recommendation C of the European Systemic Risk Board (ESRB) recommendation on funding of credit institutions from 20 December 2012 (ESRB/2012/2).
[58] Data as of the reporting date 31 December 2025, if not otherwise indicated. Supervisory reporting includes, for instance, prudential reporting (common reporting – COREP), FINREP, as well as reporting on funding plan data. It must be noted that there are, partially, certain differences between reporting samples (on the sample of reporting banks, see Annex II) and reporting requirements, such as in the level of consolidation. The funding plan data are based on projections as of December 2025. See also the EBA’s Guidelines on funding plan reporting. In funding plan data-based figures, ‘A’ stands for ‘actual’ numbers, ‘F’ for forecasted numbers. On the indicators used, see the EBA’s methodological guide on EBA indicators for risk assessment and resolution.
[59] Being an unbalanced sample, the number of reporting banks per country may sometimes display certain variations between quarters, which might affect quarterly changes in absolute and relative figures accordingly, and therefore changes in risk indicators for country-level aggregates must be read with caution.
[60] There may be slight differences between some of the risk indicators covered in the Q4 2025 version of the EBA Risk Dashboard and this report, as a result of data resubmissions by banks. The Annex to the Risk Dashboard also includes a description of the risk indicators covered in this report and their calculations, and further descriptions are available in the EBA’s guide to risk indicators.
[62] The results of the RAQ are also published separately on a semi-annual basis. These published RAQ booklets (latest published version is from spring 2025) also include explanations of the questionnaire and the analysis of the RAQ responses.
[63] The sample of banks is regularly adjusted to take into account bank-specific developments; for example, banks that ceased activity or underwent a significant restructuring process are not considered further. Not all banks are subject to all reporting requirements (e.g. those for FINREP, funding plan data). The list of banks that form the basis for the risk indicators refers to the sample of banks used to calculate the Q4 2025 indicators. The list of reporting institutions is available on the EBA website.