This Risk Assessment Report (RAR) was prepared by the Economic and Risk Analysis Department.[1] The report has benefited from input and comments from other Departments across the European Banking Authority (EBA), as well as from members of the EBA’s Supervision, Risks and Innovation Standing Committee (SUPRISC), the Subgroup on Resolution Planning Preparedness (SGRPP), and the EBA’s Board of Supervisors (BoS). Many thanks also to the editors of this version of the RAR. In case you would like to provide comments on this report please write to rast@eba.europa.eu.
Executive summary
Geopolitical instability and rising fiscal pressures are increasing risks for European banks. Macroeconomic uncertainty including geopolitical and global trade tensions are compounded with political uncertainty across Europe. Rising sovereign debt has in some cases led to higher risk premiums on government bonds and heightened volatility in funding markets. Since interest rates have risen, European banks have increased their exposures towards sovereigns, which not only affects their asset side mix but also the composition of high-quality liquid assets (HQLA).
The use of geoeconomic instruments – such as tariffs or other trade related measures – globally increases the uncertainty of the macroeconomic situation. Despite the agreement on the trade framework between EU and US counterparts announced in late August, trade-related uncertainty remains high. Direct credit exposures of EU/EEA banks to the US are not negligible. Coupled with the complexity of global value chains’ indirect exposures, they can amplify the EU/EEA banking sector’s vulnerability to external geopolitical and geoeconomic shocks. An event study by the EBA related to the trade related events in April this year shows that banks with higher indirect non-financial corporates’ (NFCs) exposures to the US experienced more pronounced negative reactions in their stock prices, highlighting the importance of monitoring both direct and indirect channels of risk transmission.
The impacts of geopolitical and geoeconomic risks extend beyond market volatility to broader financial stability concerns. Implications not only involve potential deterioration in banks’ asset quality but also affect the strategic realignment of banks’ priorities, such as adjustments of lending strategies and their sectoral focus. They also require a strategic overhaul of risk management frameworks and operational practices. EU/EEA banks continue to formalise governance for these risks, enhance due diligence, and embed scenario planning and crisis management frameworks into their core processes.
Third-country NBFI exposures are rising, highlighting new risk dynamics. Banks have significantly increased their exposures to non-bank financial intermediaries (NBFIs) in recent years, particularly in the Cayman Islands and the UK, while exposures towards US remain the most significant. The growing interlinkages with NBFIs increase the risks for EU/EEA banks given the opacity and idiosyncratic risks hidden in this sector. These trends underscore the importance of their ongoing monitoring and prudent risk management. Developments related to some bankruptcies in the US automotive parts sector as well as some volatility related to US regional banks in mid-October brought the interlinkages between banks and the NBFI sector into focus. These developments also affected financial markets, not least spreading from the US to Europe. Although this was a rather short-term impact, it demonstrates how quickly financial markets’ situation may deteriorate and spread globally.
Recovery in real estate markets and a robust labour markets are positive to banks’ asset quality. Despite macroeconomic uncertainty, robust employment levels and recovering residential real estate markets are providing support for the stable asset quality of European banks. European banks’ equity indices have outperformed other industries and their peers in other jurisdictions.
Lending growth is driven by household demand and sector-specific investments. Household lending, especially mortgages — has been the primary driver of loan growth, with banks expanding their portfolios despite macroeconomic uncertainty. Demand for mortgages and consumer credit remains strong, underpinned by their lower interest rates and consumer confidence. At the same time, banks are increasing their exposures to sectors aligned with EU strategic priorities, such as energy, utilities, and technology, reflecting both policy direction and the need for infrastructure and defence investment.
Asset quality remains resilient despite elevated Stage 2 loan volumes. The cost of risk and non-performing loan (NPL) ratios remain near historic lows as asset quality of banks is supported by robust labor markets and improved collateral values, especially in real estate. EU/EEA banks, however, continue to report a high share of Stage 2 loans, particularly in commercial real estate (CRE) and small and medium-sized enterprises (SMEs), which has not yet translated into an increase of defaulted loans or higher provisioning levels.
Retail deposits remain the cornerstone of bank funding, while volumes of market-based instruments show selective growth. Customer deposits from households and non-financial corporations (NFCs) account for nearly half of banks’ total liabilities, underscoring their importance in their funding mix. Despite periods of uncertainty and decreasing deposit rates, banks have maintained a steady deposit base and intend to keep retail deposits as their key funding focus area going forward. Meanwhile, senior preferred debt instruments have seen increased issuance volumes, reflecting banks’ preference for stable funding sources during market volatility and their need to meet regulatory requirements. Covered bonds and non-preferred senior instruments are again expected to gain more attention going forward, although overall debt and capital instrument issuance volumes have declined in 2025 compared to the previous year.
EU/EEA banks maintain robust liquidity while liquidity buffers shift towards sovereign assets. Liquidity ratios remain comfortably above regulatory requirements. The composition of HQLA has changed, as cash and central bank reserves have decreased, while Level 1 sovereign debt and covered bonds have grown, resulting in a larger share of these assets within the HQLA mix. The rising share of sovereign assets may expose banks to market volatility risks, which is not the case for cash and central bank reserves. Furthermore, some EU/EEA banks may be exposed to foreign currency liquidity risks, particularly in USD.
EU/EEA banks’ capital reached new record highs, despite the increase in risk-weighted assets (RWA) caused mainly by operational risk. The latter is not least due to the implementation of CRR3/CRD6. Despite the shifts in banks’ RWAs composition, banks’ core equity tier 1 (CET1) capital and leverage ratios improved further, with CET1 headroom above requirements expanding to nearly 500 bps, reflecting strong profitability. The CET1 ratio reached a new all-time high at 16.3% in Q2 2025. The progressive phase-in of CRR3 rules is expected to further impact capital requirements, but banks have time to adjust before full implementation.
Operational risks for banks remain elevated in 2025, with cyber and ICT-related threats, fraud, and legal risks continuing to drive both direct financial losses and broader concerns about resilience and stability. In the second half of 2025, the volume of cyber-attacks affecting financial institutions has levelled off but remains high, with nearly half of the banks reporting no major attack for the first time in three years. Distributed denial of service (DDoS) attacks, primarily by hacktivists, dominate the threat landscape, while ransomware remains the most impactful threat. The implementation of the Digital Operational Resilience Act (DORA) is strengthening incident management and cross-border coordination, but outsourcing risks and dependencies on third-party providers — especially in cloud and payment systems — have increased. Fraud risk, not least amplified by the use of AI in financial crime, is now the second most significant operational risk, posing a growing threat to public trust and financial stability.
Despite downward pressure from net interest income (NII), EU/EEA banks continue to deliver high profits, supported by resilient fee and commission income and cost control. Over the past year, banks have faced a notable decline in NII, driven by tightening margins. However, other sources of income have compensated for this decline, enabling banks to sustain their profitability levels.
Cost efficiency is moving to the forefront of banks’ strategies for sustaining profitability. Total costs as a share of equity have decreased. Furthermore, cost of risk (CoR) is at one of its lowest levels reported, averaging around 50 bps for EU/EEA banks. Key cost-cutting strategies such as automation, digitalisation, and outsourcing are gaining traction, reflecting a strategic shift from income generation to expense management. Looking ahead, most banks do not expect a further increase in return on equity (RoE), but they focus on cost efficiency and fee income growth to tackle potential pressure on profitability.
Introduction
This report describes the main developments and trends in the EU/EEA banking sector and provides the EBA outlook on the related main risks and vulnerabilities.[2] The Risk Assessment Report (RAR) is based on qualitative and quantitative information collected by the EBA. The report’s key data sources are the following:
- EU/EEA supervisory reporting[3];
- the EBA Risk Assessment Questionnaire (RAQ) addressed to banks;
- market intelligence, as well as qualitative micro-prudential information.
This report follows the common structure of the EBA’s RARs. The RAR builds on the supervisory reporting data that competent authorities submit to the EBA on a quarterly basis, for a sample of 164 banks from 30 EEA countries (131 banks at the highest EU/EEA level of consolidation from 26 countries)[4]. Based on total assets, the sample covers more than 80% of the EU/EEA banking sector. In general, the risk indicators and other supervisory reporting-based charts and analysis are based on an unbalanced sample of banks, whereas charts related to the risk indicator numerator and denominator trends are based on a balanced sample[5]. When referring to countries in the following, the respective data are based on the sample of banks applicable for this jurisdiction (see Annex I), if not otherwise stated. The text and figures in this report refer to weighted average ratios unless otherwise indicated[6]. In selected cases, some of the analysis covered in this RAR is based on data from other reporting and data submissions, such as the EBA’s European reporting system for material CFT/AML weaknesses (EuReCA)[7].
The RAQ is conducted by the EBA on a semi-annual basis, with one questionnaire addressed to banks[8]. Answers to the questionnaires were provided by 85 European banks (Annex I) during August and September 2025. The report also analyses information gathered by the EBA from informal discussions as part of the regular risk assessments and ongoing dialogue on risks and vulnerabilities of the EU/EEA banking sector. The cut-off date for the market data presented in the RAR was 31 October 2025, unless otherwise indicated.
Along with the RAR, the EBA is disclosing bank-by-bank data as part of the 2025 EU-wide transparency exercise for four reference dates (September 2024, December 2024, March 2025 and June 2025). The transparency exercise is part of the EBA’s ongoing efforts to foster transparency and market discipline in the EU internal market for financial services, and complements banks’ own Pillar 3 disclosures, as set out in the EU’s CRD. The sample in the 2025 transparency exercise includes 119 banks from 25 countries at the highest level of consolidation in the EU/EEA as of June 2025[9]. The EU-wide transparency exercise relies entirely on COREP / FINREP data.
Macroeconomic environment and market sentiment
Impact from global trade and geopolitical tensions mitigated from robust employment
Macroeconomic uncertainty and global trade tensions have challenged the European economic activity, moderating economic growth. In the first two quarters of 2025, the EU’s gross domestic product (GDP) grew modestly by 0.5% and 0.2%, respectively (Figure 1). The European Commission estimates 1.4% GDP growth for 2025 as the economy demonstrated resilience to global trade tensions.[10] This was not least due stronger-than-expected export performance ahead of anticipated tariff adjustments, underpinned by investments in equipment and intangible assets. The EU confidence indicators show confidence in industry lags markedly behind other sectors such as construction, retail trade and services[11]. Business and consumer confidence indicators remain notably below their historical average since April 2025, when trade tensions intensified.

Source: Eurostat
Inflation in the EU remained slightly above 2%. It was reported at 2.6% in September 2025, indicating stable price dynamics (Figure 2). European Commission projections suggest a further slowdown in inflation, reaching 2.1% in 2026, as disinflationary factors from ongoing trade tensions release the demand pressure.[12] Yet, with geopolitical uncertainty remaining elevated there may be downside risks. The European Central Bank (ECB) responded by loosening its monetary policy during the first half of the year. In June 2025 the ECB lowered its deposit facility rate by 25bps to 2% and has since maintained that level. Alongside ECB actions, several national central banks also adjusted their monetary policies. For example, Poland and Sweden each reduced their key interest rates in several instances during 2025. The US FED lowered the federal funds rate range from its 4.25 to 4.5% corridor to a 4.0 to 4.25% corridor in September and by another 25bps in October.

Source: Eurostat
Employment within the European Union continues to expand, accompanied by rising wages that indicate a strong and competitive labour market across Europe. In September 2025, the EU unemployment rate maintained its consolidating trend, stabilising at 6% of the total labour force for two months in row. Projections from the European Commission suggest it will reach a new historic low of 5.8% in 2027.
Ongoing improvements in employment and wage levels, together with easing inflation and modest reductions in interest payments, due to lower interest rate environment, are anticipated to further elevate household gross disposable income. Nevertheless, the decline in consumer confidence implies that consumption may remain subdued due to increased precautionary saving behaviours. This is partly reflected in the household saving rate (14.6%), which is comparatively high.
Equity prices of European banks show remarkable gains despite heightened market volatility
Despite the tail risks and the pockets of market volatility due to geopolitical tensions and abrupt changes in global trade policies, equity markets have performed sufficiently well during the year, raising some concerns around valuations. Although equity prices showed heightened sensitivity to tariffs announcements and uncertainty around trade policies (see Box 4), they showed notable resilience and recovered swiftly. However, some developments – such as the rather temporary drop in bank share prices in mid-October amid concerns related to US regional banks and banks’ private credit exposures – also showed how quickly the situation on financial markets can deteriorate and how quickly negative developments can spread.
Since the start of the year, the Euro Stoxx banks index (SX7E) gains have approached 60%. In comparison, the general Euro Stoxx index reported gains of close to 14%. EU banks’ equity index performance compares favourably against not only other jurisdictions but other industries too (Figure 3). The favourable environment is also reflected in the price-to-book multiples of European banks, which have increased remarkably (trading well above 1 and close to levels only seen before Great Financial Crisis in 2008) and significantly reduced the long-standing gap with their US peers. At the same time spreads of all instruments across the capital stack of European banking sector tightened reflecting the positive sentiment for the sector (Figure 21 on cash asset swap spreads). Investors and bank sector analysts show increased confidence on banks’ future equity performance – yet they continue to warn that geopolitical (and political) or macroeconomic risks leave the banking sector susceptible to adverse developments. Investors are not only sensitive to global trade tensions, but they are also cognizant of the fact that EU banks’ main income driver, net interest income, is under pressure (see Chapter on Profitability). Earnings results of certain EU/EEA banks have for instance shown in recent quarters that investors are not least particularly sensitive to NII trajectories. Around the Q3 results’ season, investors’ sensitivity was similarly pronounced, for instance related to banks’ US and private credit exposures as well as to litigation related risks.

Source: Refinitiv
Housing markets recovery and commercial real estate stabilisation supportive for banks
The residential real estate market in the EU is going through a recovery, marked by rising prices and market activity. Lower borrowing costs have helped demand for mortgages. On the supply side, according to market participants new construction remains insufficient, with building permits at historically low levels. As a result, house prices have increased by 5.7% year-on-year as of the first quarter of 2025. This demand-supply deficit is also fueling pressure on the rental market, where rents in several jurisdictions have reached record highs. Several markets across the continent show a fast growth rate in prices.

Source: Eurostat

Source: Eurostat
For example, Spain's housing prices recently surged by 3.6% quarter-on-quarter, marking the strongest growth among the six largest EU economies. Prices in the housing markets for instance in Poland and Netherlands continued to show increases while other jurisdictions such as Italy’s residential real estate prices remained relatively flat in the last quarter considered, highlighting divergent housing market dynamics across the region (Figure 4). Commercial real estate markets further stabilised in 2025, reporting an average growth rate of 1.6% during the first nine months of the year, according to Green Street commercial property price index. However, there are still some pockets of risk as analysts warn about specific segments of the market, such as offices[13].
Fiscal conditions in several countries may challenge banks
Geopolitical tensions around the world have notably intensified fiscal pressures across the EU, with greater allocations to military defence, infrastructure investments and foreign military aid contributing to the rise in sovereign debt. In the first quarter of 2025, the EU member states’ debt-to-GDP ratio reached 81.8% of their GDP, a 0.8 pp increase since end-2024 (Figure 5)[14]. Pressure on fiscal conditions is expected to further intensify. Germany’s new investment package largely contributes to the EU’s increase in public debt, with borrowing in 2025 projected to exceed EUR 143 bn by year-end. At the same time, several jurisdictions are increasing their defence and infrastructure spending which is estimated to contribute additional 1.1 percentage points of GDP over 2025-2029.[15]

Source: Eurostat
Political instability in parts of Europe may challenge fiscal management and investors’ confidence. In several EU member states budget reforms are stalled and there is heightened uncertainty over tax and spending. As a result, markets are increasingly demanding higher risk premiums on government bonds due to concerns over fiscal discipline and delayed reforms (Figure 6). This includes the challenge of increasing defence spending, while governments need to provide support over spending demands amid slow growth and high living costs. As a result, some governments still face pressure to increase social transfers, subsidies, and public wages, making it hard to cut fiscal stimulus measures despite elevated levels of debt while at the same time they need to achieve minimum targets over defence and infrastructure spending. This social and geopolitical pressure complicates deficit reduction, causing debt ratios to rise even as the EU urges fiscal restraint. The rising cost of sovereign borrowing and uncertain fiscal outlooks have a direct effect on EU/EEA banks. Higher borrowing costs diminish the market value of sovereign bonds held by these institutions (see Chapter on Asset side) and negatively impact profitability (see Chapter on Profitability). Furthermore, heightened sovereign risk typically results in wider credit spreads throughout the banking sector, thereby raising the cost of capital and debt issuance for banks (see Chapter on Liabilities: funding and liquidity).
Second, political instability can undermine investor and consumer confidence, depressing credit demand and investment activity. When fiscal policy becomes unpredictable, businesses delay investment decisions, households reduce spending, and loan growth slows. This weighs on banks’ income from lending and fees. At the same time, uncertainty about future taxation, regulation, or public spending can tighten financial conditions — as seen when political tensions in France in 2024-2025 temporarily drove volatility in bond markets and hurt bank stock valuations. Persistent instability therefore adds volatility to funding markets and reduces the appetite of global investors for European financial assets.
Asset side
Assets: volume and composition
Debt securities dominate the growth in assets
EU/EEA banks reported total assets of EUR 29 tn as of June 2025, indicating a 3.7% increase compared to June 2024. This represents a rise of over EUR 1 tn, primarily due to an increase of approximately EUR 635 bn (3.6%) in loans and advances, and EUR 484 bn (12.8%) in debt securities. As of June 2025, EU/EEA banks had their largest holdings in loans and advances (EUR 18.2 tn), and debt securities (EUR 4.3 tn). EU/EEA banks’ cash balances continued their decreasing trend, and they fell just below EUR 3 tn – a level comparable to the beginning of the Covid pandemic (see similarly the decline in cash as part of the HQLA in Chapter on Liquidity positions and NSFR). Despite these adjustments, the composition of EU/EEA banks’ assets remained largely unchanged, with small changes in the share of debt securities (14.7% versus 13.5% in Q2 2024) and a continued decrease in the proportion of cash balances (10.2% versus 11.8% in Q2 2024) (Figure 7). Indications from preliminary Q3 results analysis are that total assets as well as client loans have remained broadly stable compared to Q2 data[16].

Source: EBA supervisory reporting data
Macroeconomic uncertainty weighs differently on banks’ portfolios
Macroeconomic uncertainty, also related to tariffs and trade relations or geopolitical tensions in Eastern Europe and Middle East, seem to have only small effect on banks’ risk appetite as far as household lending is concerned. EU/EEA banks continued expanding their household loan portfolio, with a particular focus on mortgage lending. This shows that lower interest rates and the robust employment market mitigate the effect of this uncertainty on both demand and supply of credit[17]. The EBA’s Autumn 2025 RAQ results confirm this assumption[18]. They show that more than 60% of banks expect an increase in demand for mortgages and only 5% expect demand to decrease, while around 35% of banks suggest demand will increase for consumer credit. The factors driving this demand for household loans include for instance interest rate levels and real estate dynamics.
During the last year, lending to households increased by 2.9% YoY, or around EUR 200bn. The total loans to households were close to EUR 7.2 tn, primarily driven by a surge in mortgage loans (+2.8% YoY), reaching EUR 4.6 tn. Consumer credit increased much more sharply over the year (+5.8% YoY), yet this was attributed to the second half of 2024 as the increase during the first half of 2025 was much slower (+1.1% YtD). The slowdown might not least be due to a further escalation of the economic uncertainty. Dutch and Italian banks were those driving this increase, primarily through mortgage lending. Banks of both countries reported a growth in mortgages of more than 4% YoY, while banks of Germany, France and Spain reported slow or even negative growth.
The effect of macroeconomic uncertainty seems to have had more impact on corporate lending as it grew markedly slower than household lending. ECB’s bank lending survey shows that while interest rates had a positive effect, global uncertainty and trade tensions had a dampening impact on demand for corporate loans or credit lines in the Euro area (EA). The EBA’s RAQ results show that demand for corporate loans has been mainly supported by sector-specific investments and interest rate levels, while real estate dynamics were also a positive contributor. However, input cost pressures and tightening of credit standards mitigated the demand for corporate loans. ECB’s bank lending survey confirms that credit supply was affected by perceived risks related to the general economic and banks had tightened their credit standards because of sector and industry-specific risks.
In Q2 2025, EU/EEA banks reported EUR 6.4 tn corporate loans, around 1.8% higher than a year earlier. This represented an increase of more than EUR 115 bn. Loans to SMEs increased by 1.2% (EUR 30 bn) and towards for loans collateralised by CREs by 1.7% (EUR 24 bn), indicating that the growth in corporate loans was a result of a considerable increase in non-SME lending or large corporates (+2.3%). Data as of Q3 shows a marginal growth in outstanding loans towards SMEs and CREs, while lending to large corporates remained stable. German and Dutch banks were the main drivers of the increase in non-SME lending, with the former also contributing notably to the growth in SME loans.
Despite the uncertainty weighting on demand and supply factors, EU/EEA banks show confidence in increasing their exposures to SMEs. While this intention is widespread, banks in Eastern European countries and the Nordics reported higher levels of agreement compared to other regions. RAQ results also show that the number of banks planning their involvement in project finance is increasing, mainly driven by banks in the Western European countries[19]. At the same time, only a handful number of banks have the intention to deleverage their portfolios (Figure 8).

Source: EBA Risk Assessment Questionnaire
Geopolitics influence sector-specific lending and affect sovereign exposures risk profile
While corporate lending growth has been relatively subdued compared to households, there are sectors that have benefitted more due to policy direction influenced by geopolitics and need for support for increase in defence spending and investment in infrastructure. For example, the biggest increase in relative and absolute values across all sectors was for exposures towards energy and related utilities sector. Banks increased their lending by more than 10%, or EUR 33 bn on a YoY basis. These activities include mainly power plants (fossil fuels, nuclear, hydro, solar, wind, etc.) but also grid operation and electricity supply to end-users. This presumably reflects not only the need for strategic autonomy in electricity production, but also the turn to a greener and more sustainable European economy. The activity with the second fastest growth rate was information and technology (5%, or EUR 11 bn YoY), which presumably reflects the drive towards digitalisation of European economies.
According to responses from the EBA’s risk assessment questionnaire, these trends are anticipated to further intensify in the future. More than half of the banks expect loan demand for security and defence as well energy and utilities to increase in the next 12 months, while around 40% of the banks expect increasing demand from the technology and telecommunication sector. At the same time EU/EEA banks are increasingly prioritising project financing, with a heightened focus on infrastructure development lending. In addition, the EU’s strategic priorities related to security and defence continue to have a notable impact on banks’ lending strategies, especially across Western and Eastern Europe, while larger institutions are more likely to participate in or plan for this type of financing (Figure 9).

Source: EBA Risk Assessment Questionnaire
Rising defence spending requirements and growing fiscal deficits in several EU member states have brought renewed attention to the risks associated with sovereign holdings for EU/EEA banks (see Chapter on Macroeconomic environment and market sentiment). While defence spending may have a positive economic growth effect, it also poses risks given the high debt levels of some countries. Notwithstanding the broader economic effects of worsening sovereign fiscal conditions (e.g. through increased funding costs, higher country risk premium, limited fiscal capacity of countries to support economic growth if needed), banks, as borrower, bear direct market and credit risks for these exposures. Banks may face higher market risk from mark-to-market losses for sovereign debt securities held at fair value if yields or spreads increase, as well as rising funding costs. This was partially demonstrated by the market fluctuations resulting from the political uncertainty in France. They may also encounter greater credit risk due to potential spillover effects in corporate and financial sectors.
This issue has become increasingly pertinent considering the heightened sovereign exposures within the EU/EEA banking sector. As of June 2025, EU/EEA banks reported EUR 4 tn in sovereign exposures, representing a 14% increase compared to June 2024 (EUR 3.5 tn)[20]. This rapid uptick reflects a broader, long-term pattern of gradual but consistent growth in sovereign exposures (see also changes in HQLA composition in Chapter on Liquidity positions and NSFR). The ratio of sovereign exposures to CET1 has accordingly further increased to 226% as of June 2025, marking its highest level since the onset of the pandemic. Nevertheless, there is considerable variability among countries, as banks in certain jurisdictions report sovereign exposures exceeding 300% of their capital, with significant part towards domestic exposures. Supervisory reporting indicates a continued shift by banks away from domestic sovereign holdings, with a growing preference for exposures to other EU/EEA countries. As of June 2025, 45% of banks’ sovereign exposures were allocated to their home countries, compared to 53% in June 2018, while exposures to other EU/EEA countries increased to 31%, up from 25% over the same period (Figure 10). This might not least be due to the particularly strongly rising debt levels in some countries such as Germany, whereas sovereign debt growth was lower in other countries (see Chapter on Macroeconomic environment and market sentiment).

Source: EBA supervisory reporting data
The sovereign risk is partially mitigated by the maturity profile and accounting classification of these exposures. EU/EEA banks have maintained a relatively stable maturity profile for their sovereign exposures in recent years. Supervisory data shows that 48% of these exposures have maturities exceeding five years, while 21% mature within one year. Although the typically long duration of sovereign exposures renders them susceptible to spread widenings and market fluctuations, only 40% of these exposures have a direct impact on banks’ capital positions or profitability. Banks classify 19% of their sovereign exposures under fair value through P&L including trading and 21% through other comprehensive income.
Market volatility may expose vulnerabilities within the financial sector
EU/EEA banks report around EUR 6.3 tn (+8% YoY) of their assets at fair value, representing 21.7% of their total assets. Most of these assets were classified as Level 2 (58.4%) and Level 1 (36.7%). The significant proportion of fair valued assets amid elevated market valuations and increased macroeconomic uncertainty exposes banks to valuation and liquidity risks[21]. Geopolitical including geoeconomic tensions have contributed to periods of market volatility over the past year. Should market conditions change rapidly — as was the case following the US tariffs announcements in April 2025 (Box 4) — the observable inputs for valuing these assets may become more volatile, potentially resulting in asset re-pricing and exerting pressure on banks’ earnings and capital.
These risks are even more relevant as banks increased considerably their exposures towards other credit institutions and other financial corporations (corresponding to NBFIs). Loans and advances towards credit institutions increased by 7.6%, or EUR 82 bn amounting to EUR 1.2 tn, while for other financial corporations they increased by 10%, corresponding to EUR 134 bn, amounting to EUR 1.5 tn in June 2025 (as covered in Chapter 3.1 on funding, interbank funding also increased on the liability side). These exposures, usually, take the form of interbank deposits, repos, derivatives or direct lending. Similarly, banks increased their debt holdings issued by other financial corporations by 5% (EUR 13 bn) and those issued by credit institutions by 10% (EUR 60 bn), yet these exposures are less significant for the EU/EEA banking sector. This follows a longer-term trend of increasing debt securities holdings towards these counterparties, along with general governments (Figure 11).

Source: EBA supervisory reporting data
The higher reliance of inter-financial sector funding is partly caused by shifts towards tighter monetary policy and the end of TLTRO (see on the funding related considerations Chapter on Funding – state of play). While these inter-financial sector linkages can improve liquidity circulation and market efficiency, they also raise questions around systemic risk and financial stability. Elevated exposures may reflect surplus liquidity in the system or heightened demand for funding among certain institutions, while in some cases they may signal a search for yield behaviour among credit institutions that shift their excess funds towards NBFIs offering relatively higher returns. A shift toward wholesale/interbank funding can make banks more vulnerable in periods of stress (see chapter Liabilities: funding and liquidity), while stronger interconnections within the banking sector as well as with NBFIs raise the potential for stress at idiosyncratic cases to spread quickly to other institutions. Pronounced market fluctuations may expose and exacerbate vulnerabilities arising from liquidity mismatches and elevated leverage within certain segments of the financial sector. This may be amplified by the relevant opacity of NBFIs, which makes risk concentration harder to monitor.
NBFI financing drives the increase of exposures to third countries
Transparency concerning exposures to NBFIs is particularly crucial, given that a significant portion of these exposures is towards third countries. The total non-EU exposures held by EU/EEA banks have risen over the past two years, a trend that is closely linked to the increase in NBFI-related activities. Exposures to non-EU counterparties totalled EUR 4.6 tn, representing a 4.8% increase compared to June 2023 levels (EUR 4.4 tn). Following their previous strong rise, exposures towards non-EEA remained stable during the last year. The growth since June 2023 was primarily attributed to significant increases towards the US (+14%, or EUR 163 bn) and the Cayman Islands (+64%, or EUR 82 bn). Exposures to the US amounted to EUR 1.3 tn and towards the Cayman Islands to EUR 210 bn. During the last year, exposures towards UK counterparties also increased notably (+3.2%) to EUR 940 bn, while exposures towards Japan decreased by more than 20% to EUR 171 bn (Figure 12).

Source: EBA supervisory reporting data
The increase in exposures towards counterparties domiciled in the Cayman Islands and the UK was mainly due to growth in NBFI financing. The rise in UK exposures reflected increased lending by French and German banks to UK NBFIs and investment in UK sovereign debt, while that to the Cayman Islands was driven by French and Spanish banks.
The total exposures to NBFIs domiciled in third countries amounted to EUR 1.2 tn, representing a 10% YoY increase and close to 30% in the last two years. Of this amount, more than EUR 475 bn is attributed to US counterparties (even larger than total exposure to US corporates which amounted to EUR 375 bn), while approximately EUR 200 bn relates to entities domiciled in the UK and Cayman Islands. Although exposures to EU-domiciled NBFIs entail certain risks, these are at least partially mitigated by the presence of harmonized EU regulations, supervisory oversight, and robust legal protections. In contrast, third-country NBFIs are not necessarily subject to such safeguards, rendering them more challenging to supervise, less transparent, and potentially more likely to exacerbate shocks for EU banks.
Asset quality trends
NPL volumes declined slightly albeit with diverging country and segmental trends
The effects of macroeconomic uncertainty, geopolitical risks or the impact of new tariffs have not been, so far, reflected in the overall level of non-performing loans (NPLs) in the EU/EEA. The lower interest rate environment, coupled with the robust employment market have helped to mitigate the impact on asset quality. Nevertheless, there are certain divergences across countries and segments.
As of June 2025, EU/EEA banks reported EUR 373 bn of NPLs. This remains unchanged from the previous year, and slightly above their lowest level reported since the EBA has collected supervisory reporting data (EUR 357 bn in March 2023). The NPL ratio was reported at 1.84% (2bp lower than a year before), while the NPL coverage ratio slightly decreased to 41.7% (42% in June 2024). These metrics offer a reassuring outlook for the banks’ asset quality, which is confirmed by preliminary supervisory data for Q3, according to which the volume of NPLs and the NPL ratio remained stable. Nevertheless, there are differing trends across the EU/EEA. Several Southern European countries, which had in the past comparatively high NPL levels, including Spain (-8%), Italy (-7%), Portugal (-16%), Greece (-11%), and Cyprus (-21%), have reported further reductions in their NPL volumes. In contrast some of the large countries with comparatively lower NPL levels in the past such as France (+2%) and Germany (+12%) reported NPL increases compared to June 2024. Banks in these two countries reported an NPL increase of EUR 5bn. At the same time, some smaller countries such as Romania reported a much higher increase (+25%) (Figure 13).

Source: EBA supervisory reporting data

Source: EBA supervisory reporting data
Divergences are not only evident across countries but also across different segments. EU/EEA banks reported a slight increase in the NPLs of unsecured segments while NPLs of secured lending marginally edged down. As a result, consumer credit (5.4%) and SME loans (4.6%) recorded slight increases in NPL ratios. In contrast, NPL ratios of mortgages (1.4%) and CRE exposures (4.2%) were lower compared to a year earlier (Figure 14).

Source: EBA supervisory reporting data
The marginal differences reported in the NPLs mask the actual flows of defaulted assets through banks’ balance sheets. An examination of flows in and out of non-performing status, reveals that the NPL inflows remain significant and have not slowed down. In the first half of 2025, banks reported total NPL inflows of around EUR 110bn, broadly unchanged from the previous year, against outflows of nearly EUR 114 bn. Outflows, were reported higher reflecting the efficiency of banks to effectively manage these loans - either through cures, write-offs or selling of these assets. Segment level data show that the biggest contributor to NPL inflows was SMEs (EUR 32bn) and consumer credit (more than EUR 20bn), yet for both segments banks also reported significant outflows (EUR 31 bn and EUR 19bn). Real estate collateralised lending (RRE and CREs), on the other hand reported a net outflow of NPLs, mirroring the stabilisation in the real estate markets.
Loan-to-value ratios for real estate-related loans indicate positive trends
Loan-to-Value (LTV) data show that overall collateralisation of real estate loans has improved, especially in the residential segment. By June 2025, 57% of RRE exposures had an LTV below 60% (up from 52% a year earlier), while the share of loans exceeding 100% of property value fell from 6% to 3%. This points to a more resilient risk profile in household mortgage portfolios. The picture has improved but is less benign for CRE loans, where the share of low-LTV exposures rose modestly (to 64%), but high-LTV loans (>80%) still account for nearly 20% of the portfolio.
Country-level differences, however, remain material. France and Germany stand out with relatively low shares of high-LTV loans in the CRE segment, supporting the resilience of their banks against potential shocks in CRE markets. Similarly, Greece and Slovakia show a declining proportion of loans with LTVs above 80%, suggesting an improving risk profile. By contrast, several Eastern European countries report a notably higher share of high-LTV CRE exposures, in some cases exceeding 30% of their portfolios. This concentration of riskier loans highlights potential vulnerabilities should property valuations weaken again (Figure 15).

Source: EBA supervisory reporting data
The cross-country variance underscores the need for continued monitoring of CRE exposures, which remain a potential source of vulnerability given their cyclicality and sensitivity to interest rate changes and the structural changes that took place in the sector post-pandemic. The relatively stronger position of large core jurisdictions helps to offset some of the systemic risk, but pockets of vulnerabilities persist in smaller markets with structurally higher LTV ratios.
Banks' survey indicates a positive outlook for asset quality
Banks have reported a generally positive outlook regarding potential changes in asset quality. RAQ results reflect an improved perspective for asset quality in secured lending. According to the survey, 5% of participating banks anticipate a decline in mortgage asset quality. Banks’ view is presumably driven by the robust employment and lower interest rates. Over the past 2.5 years, expectations across all segments have also improved. However, about 35% of banks continue to expect a possible deterioration in the asset quality of SME loans, particularly among banks located in Western and Eastern European countries (Figure 16).

Source: EBA Risk Assessment Questionnaire
 Box 1: The allocation of Stage 2 loans indicates a cautious approach to asset quality assessmentWhile NPL volumes have remained close to their historic lows over the past year, Stage 2 exposures further increased compared to June 2024 data. By the end of second quarter of 2025, banks reported close to EUR 1.6 tn of exposures at amortised cost in Stage 2. This equals 9.4% of total loans classified at amortised cost, and this share is very close to the highest level reported (which was 9.7% in December 2024) since the introduction of IFRS 9. Preliminary data as of Q3 2025 shows a slight decrease in the share of stage 2 loans to ca. 9.2%. Stage 2 loans have been increasing since the pandemic. The worsening of the economic environment because of geopolitical tensions amid Russian’s aggression against Ukraine and the abrupt inflationary pressures that followed caused deterioration in the asset quality. EU/EEA banks have reported a rise of around 18% in loans with significant increase in credit risk (SICR) since end of 2021, growing from EUR 1.3 trillion. This corresponds to an increase in Stage 2 loans of close to EUR 240 bn within 3.5 years. This increase is due to a number of reasons, including deterioration in CRE and RRE markets, strong and sudden rise in interest rates affecting borrowers’ capacity to repay their obligations, geopolitical tensions and disruption in supply chains affecting SME performance as well as prudential treatment of some specific portfolios. Household lending, predominantly mortgages, served as the primary driver for the rise in Stage 2 loans, consistently contributing approximately EUR 30 bn annually through to the end of 2024. Over this period, the cumulative increase in Stage 2 mortgages totalled EUR 80 bn. The material rise in Stage 2 mortgages is also related to higher interest rates, which have impacted the repayment capacity of certain households, alongside geopolitical factors affecting economic growth, which has been subdued in several countries. Nevertheless, robust labour markets and low unemployment rates have helped mitigate further deterioration in asset quality, which this then reflected in NPL volumes and ratios. The increase in Stage 2 allocation for mortgage was broad-based. However, Dutch banks contributed significantly to this increase as a result of reclassification of a substantial cohort of interest only mortgages as a prudential act. In addition to mortgage exposures, banks increased the allocation in Stage 2 of consumer credit. This was particularly evident in 2024, when EU/EEA banks reported an increase of EUR 27 bn in the Stage 2 consumer credit. This was partly driven to re-organisation of a single credit institution, and the reallocation of certain lease receivables under Stage 2. Along with the increase in allocation in Stage 2 of household loans, banks substantially increased Stage 2 loans in NFCs too. Since the end of 2021, EU/EEA banks have increased Stage 2 allocations for loans collateralised by CREs by approximately EUR 30 bn. These increases were primarily as a response to the post-pandemic deterioration in CRE markets and related to structural changes around office markets, for instance. During 2022, EU/EEA banks also moved a substantial portion of their large corporate loans in Stage 2, which happened in response to geopolitical tensions and supply chain disruptions that affected corporates. By comparison, the allocation of SMEs loans in Stage 2 rose by around EUR 5 bn over this period (Figure 17). While this may be partly attributable to government support measures aimed at SMEs, it could also reflect a slower adjustment in response to potential changes in asset quality within this segment. 
Source: EBA supervisory reporting data 
Source: EBA supervisory reporting data Despite the fact that during the first half of 2025 EU/EEA banks have decreased marginally the loans allocated in Stage 2 by around EUR 16 bn, mostly due to decreases in CREs and mortgages, the share of Stage 2 loans remains elevated. As of June 2025, the highest share of Stage 2 loans was reported in CRE lending (17.1%), followed by SMEs (14.9%). Although consumer credit and mortgages had the biggest incremental increase since end of 2021, they were still reported substantially lower than the corporate segments. In particular the share of consumer credit Stage 2 was at 11.5% and for mortgages at 7.9% (Figure 18). 
Source: EBA supervisory reporting data While the Stage 2 allocation remains elevated, this is hardly linked to neither the evolution of NPLs, nor the cost of risk, which remain under control and near their lowest multi-year levels. Despite some cyclicality observed in the data, EU/EEA banks reported CoR at 48 bps in June 2025, close to the lowest level reported since the pandemic. The data shows that 75% of the allowances and provisions used by EU/EEA banks are related to stage 3 loans. Movements in allowances and provisions for Stage 2 are primarily influenced by increases resulting from new Stage 2 loans; however, these movements do not appear to be closely linked to changes in IFRS9 Stage 2 outstanding loan amounts (Figure 19). 
Source: EBA supervisory reporting data There may be several explanations for this potential de-link between the high level of Stage 2 loans and low cost of risk. Banks might opt to lean towards a more conservative approach when allocating loans under Stage 2 loans or they seem reluctant to transfer these loans back to stage 1. In such case the impact on related allowances / provisions would presumably be limited. Banks also use management overlays to overcome credit risk model deficiencies and to address increasing exogenous risks like geopolitical tensions and macroeconomic uncertainty. RAQ results support this idea, showing that more than 60% of the banks use overlays to address political and geopolitical uncertainties and around 40% to address sectorial and geographical uncertainties and model deficiencies. Further to this, the increase in Stage 2 loans is mostly related to secured lending. The improvement in real estate markets, both commercial and residential, have increased the value of the related collateral of these loans, and therefore require relatively lower provisions. Lastly, the classification of loans under Stage 2 which are related to prudential treatment rather than higher credit risk of the portfolios (e.g. classification of Interest only mortgages for policy decisions and reclassification of lease receivables) would not require substantial increase in provisions and allowances from the banks. |
Liabilities: funding and liquidity
Funding – state of play
Stable liability structures underscore the significant importance of deposits
Banks’ liabilities grew strongly by around 4% YoY, reaching EUR 27 tn as of Q2 2025 (preliminary Q3 data shows only a marginal change compared to Q2). The composition of liabilities remained broadly unchanged. Within liabilities, customer deposits from households and debt securities issued represent the largest share of total liabilities. Their shares remained broadly unchanged YoY, accounting for 30.7% for customer deposits from households in Q2 2025, and for 20.1% for debt securities issued. Deposits from credit institutions showed the highest YoY increase by 3% – which confirms a similar trend on the asset side, according to which interbank funding exposures increased – while customer deposits from NFCs showed the highest YoY decrease of 3%. This development confirmed banks’ intention regarding their funding mixes as expressed in the RAQ, where retail deposits are the funding instruments most respondents intend to focus on going forward, while the share of respondents indicating to focus on wholesale deposits has decreased. Preliminary Q3 data also indicates that banks have further grown their customer deposits due to a rise in NFC deposits on a quarterly basis, while deposits from credit institutions also increased.

Source: EBA supervisory reporting data
The share of other liabilities, which include central bank funding, has slightly increased YoY to 13.5%. This constitutes a changing trend after banks have significantly reduced the share of other liabilities while they wound down their exposure to central banks, from 21.3% three years ago (Q2 2022). Regarding the liability mix, dispersion among countries has remained wide. Whereas certain Eastern and Baltic banks, as well as Cypriot, Lithuanian and Portuguese banks strongly rely on household deposits, banks from Scandinavia and from some other countries have a dependency on market-based funding (Figure 20).
Increasing issuance volumes since spring amid improving market conditions
Primary funding market conditions have been more challenging around March and April 2025. At that time, a deteriorating macroeconomic outlook and uncertainty about tariffs globally contributed to higher market interest rate and spread volatility and rising yields for bank debt instruments and resulted in reduced primary market activity. Funding market conditions have improved since May, supported by benign market perceptions about banks, continued strong bank profitability, and easing immediate tensions about tariffs after the EU reached an agreement with the US on tariffs. Spreads for all instruments across the capital stack decreased again to levels observed in the first two months of this year, when market conditions were benign and issuance volumes were high. With decreasing spreads since May and improving market conditions, issuance volumes increased again. Pent up demand after reduced supply in March and April also contributed to higher issuance volumes since then (Figure 21).

Source: IHS Markit*
*With regard to IHS Markit in this chart, and any further references to it in this report and related products, neither Markit Group Limited (‘Markit’) nor its affiliates nor any third-party data provider make(s) any warranty, express or implied, as to the accuracy, completeness or timeliness of the data contained herewith nor as to the results to be obtained by recipients of the data. Neither Markit nor its affiliates nor any data provider shall in any way be liable to any recipient of the data for any inaccuracies, errors or omissions in the Markit data, regardless of cause, or for any damages (whether direct or indirect) resulting therefrom.
Covered bond issuance volume has been reduced so far in 2025 compared to the same period last year. After very low covered bond issuing in the first months of this year, volumes increased markedly since May. They are still, however, lower than last year’s issuance volumes. Contributing to this development are presumably tighter spread differentials between covered bonds and sovereign, supranational, and agency (SSA) bonds, making covered bonds relatively less attractive for investors. At the same time spreads between senior preferred and covered bonds tightened, which makes issuance of the latter relatively less attractive for banks. The share of green covered bonds, green senior preferred bonds and green Tier 2 instruments relative to total issuance volume of these instruments has increased notably compared to the previous two years, as green bonds have become more mainstream products and are increasingly used in the financing of green projects (Figure 22).
Decreasing total issuance volume of debt and capital instruments in 2025
The total issuance volume of senior preferred instruments increased compared to the previous year, while issuance volumes of all other instrument types decreased (Figure 22). Senior preferred were banks’ favourite funding instrument during episodes of higher volatility and market uncertainties. They are also one of the key components that EU/EEA banks, independent of their size, used to meet their MREL-related funding needs, while offering price advantages for issuing banks compared to more subordinated instruments. Well-functioning funding markets for these instruments are important for all groups of banks, not least to meet their ongoing MREL requirements. In comparison, senior non-preferred funding plays a similarly important role for Global Systemically Important Institutions (G-SIIs) and top tier institutions[22]. But is of smaller relevance for the group of ‘other’ banks, not least because the latter group needs to meet subordination requirements only on a case-by-case basis, depending on resolution authorities’ assessment of no creditor worse off risks.

Source: Dealogic, EBA calculations
*Based on publicly available market data, which may not completely reflect all issuances of the different types of debt and capital instruments.
Funding intentions going forward broadly reflect developments in 2025
With a share of nearly 47% in banks’ total liabilities, customer deposits from NFCs and households are the most important funding instruments. While their share in total liabilities slightly decreased between Q2 2024 and Q2 2025, their volumes increased by 2.5%. Despite periods of uncertainty and decreasing remunerations for depositors as deposit rates decreased, banks have maintained a nearly steady deposit base. EU/EEA banks intend to maintain a focus on retail deposits, and they will be a key focus area in their funding mixes for the next 12 months, based on RAQ results. Banks intend to decrease their focus on wholesale deposits, which have been more volatile than retail deposits in the past. The share of customer deposits from NFCs decreased by 0.5 p.p. YoY in Q2 2025. Reflecting increased issuance volumes this year, senior preferred is the most popular market funding instruments banks intend to focus on going forward according to the RAQ, with 49% agreement. More banks compared to the previous iteration of the RAQ also intend to focus on covered bonds (44% agreement) and non-preferred senior instruments (42% agreement) (Figure 23). These expectations might imply that issuance volumes of covered bonds and non-preferred senior bonds increase going forward reverting this year’s trend of declining issuance volumes.

Source: EBA Risk Assessment Questionnaire
The asset encumbrance ratio is increasing
The asset encumbrance ratio (i.e. the ratio of encumbered assets and collateral received to total assets and collateral received that can be encumbered) increased to 24.7% in Q2 2025, 60 bps higher than in Q2 2024, and with significant country dispersion. Preliminary data as of Q3 indicates a marginal decrease in the asset encumbrance ratio to 24.6%. This constitutes a changing trend after the ratio continued to decrease until last quarter from its 2021 peak of ca. 29%, which was not least driven by repayments of high amounts of central bank funding. In December 2024 it stood at 24.1%, 60 bps below the 24.7% reported in December 2023. The volume of encumbered assets (i.e. the numerator) increased by nearly 5% in the first two quarters of 2025 and exceeded the increase of the denominator (i.e. total assets and collateral received). Data analysis of the sources of encumbrance indicates that repo-based funding and increasing issuance volumes of asset backed securities were important drivers of the new development of rising encumbered assets (see on the rise of interbank funding in this Chapter further above and Chapter on Assets: volume and composition). Collateral requirements related to exchange traded derivatives also contributed to the rise, as well as, for example, other sources of encumbrance.
Liquidity positions and NSFR
EU/EEA banks retained their robust liquidity position as of June 2025. Their liquidity was not affected by the declining trend of cash and excess reserves due to monetary tightening and the reduction of the ECB’s balance sheet. During the last year banks continued readjusting their liquidity buffers by declining cash, central bank assets and central bank reserves and increasing their buffers of sovereign debt, covered bonds and Level 2 assets. In effect, EU/EEA banks’ liquidity buffers increased by 2% on a yearly basis since June 2024, while net outflows increased by 3% in the same period. As a result, the weighted average LCR decreased in June 2025 (161.7%) compared to June 2024 (163.1%). On average, LCR of EU/EEA banks remains well above minimum requirements and the pre-pandemic levels (147% as of December 2019). Preliminary Q3 data indicates that the LCR declined on a quarterly basis by around 1p.p..
Since June 2024, the upward trend in liquid assets was underpinned by the increase in Level 1 sovereign debt holdings that compensated the declined observed in Level 1 central bank reserves. The share of Level 1 sovereign assets has doubled since June 2022, when it represented 20% of high-quality liquid assets (HQLA), up to a share of 40% as of June 2025. The assets that increased the most on a yearly basis were Level 1 sovereigns, followed by covered bonds, whereas the rest of Level 1 assets and Level 2A and 2B declined. As shares of total assets, liquid assets represented 20.5% in June 2025 (compared with 20.7% as of June 2024), while the net outflow ratio remained broadly unchanged at 12.7% (Figure 24). On a yearly basis, both metrics declined because of an increase in the total assets (for the total sample) of 4% since June 2024, outpaced the growth observed for HQLA (2%) and for net outflows (3%).
Despite the changes observed in the composition of the liquidity buffer, cash and central bank reserves continued to dominate HQLA (Figure 24), still accounting for 49% of all HQLA (down from 57% in June 2024). Conversely, government assets and Level 1 covered bonds increased their share of total liquid assets to 4 % and 7%, respectively, by June 2025, up from 33% and 6% in June 2024[23]. Lastly, the share of Level 2A and Level 2B assets remained stable, both of them accounting for 2% of all HQLA (down from 3% and 2%, respectively, in June 2024). The rising share of sovereign assets makes the LCR also more susceptible to potential sovereign bond related vulnerabilities, including for instance market volatility. This can have some impact on their fair value and as such on the LCR.

Source: EBA supervisory reporting data

Source: EBA supervisory reporting data
The decline in Level 1 cash and central bank reserves is explained by the drop in excess reserves, which is in line with the ongoing reduction in size of the EU central banks’ balance sheets. Level 1 central bank reserves, which is the most important asset class in the stock of HQLA, dropped by 12% on a yearly basis since June 2024. Level 1 central bank assets and cash declined by 13% and 4%, respectively.
Total outflows increased because of higher outflows mainly from secured lending, other liabilities and operational deposits that were only partially matched by lower outflows from non-operational deposits and collateral swaps. The increase of outflows from secured lending is explained by the need to replace central bank funding in the context of the ongoing central bank balance sheet reduction policies as well as increased activity of EU banks in repo markets after the release of collateral since the TLTRO III repayments[24]. There has also been a continuing increase in issuance of covered bonds over the past several years, with the exception of 2024[25].
Weighted average LCRs for USD remained stable above 100%
The LCR value in EUR – reported by those banks domiciled in non-euro area countries – was 155% as of June 2025. On an annual basis, the LCR value in EUR declined up to a level that is slightly below the overall LCR. The weighted average LCR of GBP was reported at 140%, higher than a year earlier (131%), but still lower than the overall LCR. The weighted average LCR of USD, however, stood lower at 118%, with several banks still reporting below 100% (first quartile remains below 100% as seen in previous years). This indicates that the mismatch remains relevant for 39% of the banks (26 banks out of 66 banks of the sample which report the USD as a significant currency). Low levels of LCR in one or several foreign currencies may create vulnerabilities in periods of high volatility, as the possibility of banks to raise funding in other currencies or to cover the risk of FX moves on markets may be challenged. Nevertheless, the number of banks with LCR in USD below 100% has decreased over time and represent 39% of the total sample as of June 2025 (Figure 25).
NSFR confirms a comfortable liquidity position of EU/EEA banks
The NSFR saw an increase in 2024, as deposit growth has been positive since the beginning of the monetary policy easing cycle[26]. During the first half of 2025, the NSFR remained stable and maintained its level observed as of December 2024. As of June 2025, the NSFR stood at 127.2%, indicating a satisfactory level for all EU/EEA countries. Preliminary data as of Q3 indicates a ca. 40bps decrease of the ratio. By country, the NSFR ranges from 115.2% (France) to 204.9% (Romania). All banks in the sample recorded NSFR levels exceeding 100% as of June 2025. Yet, there may be some pockets of vulnerabilities in the foreign currency liquidity positions of EU/EEA banks. The weighted average NSFR in USD declined, falling to 97.5% in June 2025, down from 105% a year earlier. The number of banks with NSFR in USD below 100% remained stable in 2025 and represents 32% of the total sample as of June 2025 (Figure 25).
Retail deposits constitute nearly half of the bank's total Available Stable Funding (ASF), confirming the role these deposits have in banks’ funding composition. The second largest component are liabilities with undetermined counterparties, accounting for 14.9% of the total ASF. This is followed by capital at 13.1%, funding from non-financial customers at 12.4%, and funding from financial customers and central banks at 7.8% – the latter not least reflecting the decline in central bank funding of previous years. Other components, including funding from operational deposits, account for the remaining 3.7% of total ASF. On the denominator side of the ratio, loans are the dominant component, comprising over three-quarters of the total required stable funding (Figure 26).
|
EU/EEA banks’ capital ratios have remained at record levels driven by strong organic capital creation. The total capital ratio reached 20.4% as of Q2 2025, which is a YoY increase of 27 bps. This was primarily driven by the CET1 component, which rose by 23 bps. Additional Tier 1 (AT1) stood at close to 1.4% and Tier 2 at 2.6% of total RWA. The CET1 ratio reached a new all-time high at 16.3% in Q2 2025[28]. Preliminary supervisory data suggests that capital ratios have remained stable in Q3. Similarly, EU/EEA banks’ leverage ratio has increased by 10 bps and stood at 5.9% as of Q2 2025 (Figure 27).

Source: EBA supervisory reporting data
Overall, the volume of CET1 capital rose by EUR 73 bn (5%) in the last year (EUR 1.65 tn as of Q2 2025). The increase in CET1 capital was mainly due to rising retained earnings, which increased by EUR 88 bn (10%) on the back of strong profitability (see Chapter on Profitability). This increase was partly offset by increasing goodwill and other intangible assets as well as deferred tax assets, which banks are required to deduct from CET1 capital. Those deductions increased by EUR 18 bn (8%) in the last year (Figure 28).

Source: EBA supervisory reporting data
Capital headroom above requirements expands
EU/EEA banks’ CET1 headroom above overall capital requirement (OCR) – which consist of Pillar 1, Pillar 2 and the combined buffer requirements (CBR) – and Pillar 2 Guidance (P2G) has increased by 16 bps in the last year and stood at almost 500 bps in Q2 2025. The headroom increase is the result of a higher CET1 ratio (+24 bps) outpacing the increase in OCR (8 bps). The rise in the OCR was primarily due to an increase in the combined buffer requirement, which rose by 8 bps in the last year (Figure 29).

Source: EBA supervisory reporting data
The main driver behind higher combined buffer requirements in the last year was the systemic risk buffer (SyRB), which increased by an average of 7 bps and stood at 0.29% of total RWA as of June 2025. The average countercyclical capital buffer increased by 2 bps in the last year and amounted to 0.75% of total RWA as of June 2025. The buffer for systemically important institutions, which represents for each bank the higher of either OSII or GSII buffer, decreased by 1 bps in the last year and stood at 1.11% of total RWA. The capital conservation buffer is fixed at 2.5% of total RWA as per CRD rules (Figure 30).

Source: EBA supervisory reporting data
Both changes in CET1 ratios and CET1 requirements in the last year as well as overall levels observed as of Q2 2025 varied across banks and countries. Banks in Hungary and Italy reported increases in CET1 requirements of 50 bps or more in the last year. While the increase in the SyRB was the main driver for banks in Italy, banks in Hungary reported an increase in both CCyB and P2G. In contrast, banks in Luxembourg reported a decrease in CET1 requirements of 50 bps or more in the last year.[29] This was due to a decrease of both P2R and P2G since June 2024. CET1 ratios for Q2 2025 range from 13.2% for banks in Spain to 26.6% for banks in Cyprus. Changes in banks’ CET1 ratios in the last year ranged from an increase of more than 330 bps for banks in Cyprus to a decrease of more than 160 bps for banks in Finland. As of Q2 2025, CET1 requirements ranged from 8.5% of total RWA for banks in Poland to 16.9% for banks in Norway (Figure 31).

Source: EBA supervisory reporting data
Risk-weighted assets increase driven by operational risk
Total RWAs increased by 3% in the last year and stood at EUR 10.1 tn in Q2 2025 and remained broadly stable in Q3. The increase was mainly due to operational risk which increased by more than EUR 300 bn (30%). This increase can mainly be explained by the new rules regarding the calculation of operational risk that were introduced with the CRR3 and are applicable since January 2025. With CRR3/CRD, all existing approaches for the calculation of the own funds requirements on operational risk were replaced by a single approach, the business indicator component (BIC). The BIC bases the capital requirements for operational risk on the business indicator (BI), a financial statement-based proxy for operational risk. For banks previously using the internal model approach, the new approach typically results in higher RWA. Total operational risk RWA stood at EUR 1.3 tn as of Q2 2025, representing ca. 13% of total RWA.
Credit risk RWA decreased by EUR 116 bn (-1%) and stood at close to EUR 8.0tn in Q2 2025. Credit risk remains the largest RWA segment for banks, accounting for 80% of total RWA with market risk representing 4% of total RWA and CVA and other risks accounting for the remaining 3% (Figure 32). For banks under the IRB approach, the impact of the output floor stood at EUR 2 bn as of Q2 2025 (0.02% of total RWA). While this impact on banks’ Q2 2025 CET1 requirements and CET1 ratio was negligible, the progressive phase-in of the new CRR3 rules is expected to lead to more meaningful impacts over time. Full CRR3 implementation will occur in 2033, giving banks time and room to adjust their balance sheets until then and manage their fully loaded CET1 ratios. According to the 2025 EU-wide stress test results, the impact of the final CRR3 rules on the EU banks’ aggregate CET1 would be a decrease of around 130 bps on a fully loaded basis (assuming the final ruleset applicable as of 2033 was front-loaded on Q4 2024 data), coming mainly from the output floor, and showing wide dispersion among banks[30].
Comparing credit risk RWA movements with trends in underlying credit exposures shows a parallel downward shift. Total credit risk exposures decreased by EUR 192 bn or -0.7% in the last year, which compares with the -1.7% decline in credit risk RWA. The overall trend was driven by a decrease in exposures to corporates (EUR 290 bn or -3.6%) and to institutions (EUR 377 bn or -16.2%)[31]. Retail exposures, on the other hand, increased by EUR 290 bn (3.6%) in the last year and other exposures by EUR 137 bn (17.7%). Exposures to central governments and central banks also increased by EUR 50 bn (0.7%) in the same period (Figure 33).
RW density for credit risk exposures decreased in the last year by 30 bps and stood at 27.4%. A lower RW density means that banks are required to hold less capital for their credit risk exposure, suggesting either a lower overall risk profile, an improvement in asset quality, or a less conservative methodology to calculate RWA (or a combination of different aspects). Given the change in rules regarding RWA calculation (CRR3) that came into effect as of January 2025, part of the change will be due to the revised methodology. The two most relevant credit risk portfolios, corporate and retail, showed slightly different trends in the last year. For corporate exposures, RW density declined by 121 bps and stood at 50.5% in Q2 2025. For retail exposures, RW density has a much less decrease by 11 bps and stood at 25.5% in Q2 2025 (Figure 34).

Source: EBA Supervisory Reporting data
Despite downward pressure from NII, banks continue to deliver high profits
EU/EEA banks’ return on equity remains at high levels, standing at 10.7%, although it has declined by around 20 bps over the past year. The continuous negative impact of net interest income contributed to 185 bps to the RoE decline. Other revenue items (NFCI and NTI) contributed to this decline – despite their increase in absolute values – while other operating income had a positive contribution. However, the lower contribution of NFCI and NTI was mostly compensated by the positive impact of the expense items (Figure 35). There are notable RoE disparities between countries, with many Eastern countries exceeding a 15% RoE, whereas several Western countries fall below the 10% threshold (Figure 36). Going forward, most banks do not expect an increase in their RoE (67% of banks answered negatively in their responses to the RAQ). First indications from Q3 supervisory reporting data are that EU/EEA banks’ RoE remained stable.

Source: EBA Supervisory Reporting data
Cost of Equity (CoE) remains for most banks between 8 and 12%. However, historical data suggests a convergence towards the 10% to 12% bucket, with less banks reporting lower values and less banks reporting higher values (Figure 37).
Other income streams face challenges in compensating for NII fall
Operating income of EU/EEA banks has risen by around 3.5% YoY. However, when measured as share of equity, it has declined by around 120 bps YoY, now standing at 34.6% (Figure 38). The main driver of this decrease is the continued drop in NII. Relative to equity it fell from 21.7% to 19.9%, and its absolute amount declined by around 2.9% YoY. This trend is largely explained by the ongoing decline in interest rates, whereas the steepening of the rate curves does not seem to have had a positive impact, at least for now (on inflation and interest rates and yields see Chapter on Macroeconomic environment and market sentiment). While interest-earning assets increased, the overall decrease of NII is primarily due to a drop in the net interest margin (NIM) from 1.68% in June last year to 1.58% in June 2025. Indications from Q3 results are that the NIM remained stable. In contrast to NII, NFCI and NTI rose (absolute amounts) YoY, but their share of equity – i.e. their contribution to RoE – declined on a yearly basis. Other operating income increased in absolute value, and has more than doubled as share of equity, rising from 1.1% to 2.3% of equity. However, this increase cannot be considered sustainable as it is, in many cases rather due to extraordinary developments than banks’ core business activity.

Source: EBA Supervisory Reporting data
*Outliers cannot least be explained by the specificities of the sample of banks for respective countries, which might for instance depend on the business models of some major banks operating outside of one country. For Lithuania, for example, the data are highly influenced by one bank’s specific business model.
The decline in margins not least reflects a faster decline in interest rates for exposures to NFCs and HH vs. rate cuts for deposits over time[32]. Rates for NFC loans and debt securities dropped by 70 bps to 4.7%, while HH loan rates decreased only slightly by 10 bps to 3.9%. Deposit rates have also declined, with NFCs to 2.2% (-50 bps) and HHs to 1.4 (-20 bps). The difference between NFC and HH rates is accordingly tightening, as NFC rates decline faster than HH rates. There are also country-level discrepancies: while most countries saw a negative variation in NFC loan rates, they rose in two countries. For HH loans the picture is more mixed, with several ones seeing a rise in HH loan rates. Deposit rates have seen only marginal moves in many countries, while others have experienced more significant changes, most of them downwards (Figure 39, Figure 40).
Although NFCI has been a negative contributor as a share of equity, its absolute value has increased, reflecting banks’ strategic focus on this income stream. All components of fee and commission income have grown, especially corporate finance (+17.9%), asset management (+8.9%), and custody services (+8.6%). Going forward, NFCI also remains a main priority by banks to boost their profitability (61%), as seen in RAQ answers. NII ranks second and is associated with expectations of increased loan volumes and a positive effect from steepening yield curves. There is also a rising relevance of operating expenses and cost reduction to support profitability going forward, which might not least indicate a strategic shift from income generation to expense management amid declining NII (Figure 41).
|


Cost efficiency to move more to the forefront for sustaining profitability
Total costs as a share of equity have decreased from 24.6% to 24.0% YoY, even though they rose in absolute terms by around 4%. The cost-to-income ratio went accordingly up from 51.8% to 52.4% on a yearly basis. In relative terms, all major cost categories have declined, including staff expenses (from 10.5% to 10.4%) and other admin expenses (from 7.9% to 7.8%). Provisions (from 0.67% to 0.38%), other costs including taxes (from 2.55% to 2.48%), and contributions to the DGS and RF (down to 0.4%) also contracted. Indications from preliminary analysis of Q3 data are that banks’ cost to income ratio further improved slightly on a quarterly basis, showing banks’ efforts to manage their cost basis.
Given the decline in credit risk impairments and despite high levels of Stage 2 exposures, the cost of risk (CoR) is at the lower end compared to historical levels (see on this a more detailed analysis in Chapter on asset quality). It fell by 3 bps to an average of 0.48% for EU/EEA banks, and most countries report CoR between 0 and 50 bps (Figure 45). Q3 indications are that CoR slightly declined by 1bp on a quarterly basis. Going forward, RAQ results show that key cost-cutting strategies include automation and digitalisation, , and overhead and staff costs reduction, which gained 4 pp over the past year.

Source: EBA supervisory reporting data
M&A is gaining prominence in EU/EEA banks strategies
Market concentration across the EU remains moderate, with Herfindahl indices for most countries ranging between 0.1 and 0.2. Throughout 2024, nearly every EU country recorded at least one merger or acquisition, with the majority of countries seeing between one and five transactions (Figure 46). However, there does not seem to be a ‘direct’ link between market concentration and (announced) M&A transactions.
Fewer banks are reporting no interest in M&A activities, with the share declining by 5 pp over the past year, according to RAQ responses. This trend is particularly noticeable in Western Europe, where only 20% of banks now indicate they are not considering any mergers or acquisitions. There has been a growing interest in merging with or acquiring NBFIs, up by 5 pp, while interest in FinTech acquisitions has declined (Figure 47; on further interlinkages between banks an NBFIs see also Chapter on asset composition and exposures).

Source: EBA Risk Assessment Questionnaire
General trends
Risks to operational resilience have increased in recent years. Operational risk is defined as the risk of losses stemming from inadequate or failed internal processes, people and systems or from external events. It is embedded in all banking products and activities, and includes e.g. IT and cyber risk, fraud risk, and legal risk. Operational resilience has become a key bank sector risk, given digitalisation and technological advances, globalisation of the financial system, and materialisation of several large losses events in the past years. Risks to operational resilience have become increasingly complex and include a range of aspects. Reflecting their systemic relevance, capital requirements for operational risk are the second most important component of banks’ RWA composition after credit risk. They have increased significantly to 12.9% of operational risk capital requirements, up from 10.2% in Q2 2024. The strong increase this year is also driven by the new rules regarding the calculation of operational risk introduced with the CRR3 and applicable since January 2025 (see Chapter on capital requirements).
Geopolitical risk has enhanced operational risk
Risks to operational resilience including digital and cyber risks are not least amplified by heightened geopolitical risks, which also contributed to AML and sanction-related compliance risks (on geopolitical risks see the separate Chapter as focus topic). These risks may be a main driver of operational risks (e.g. by state-sponsored malicious cyber activity or potential acts of sabotage affecting the financial infrastructure). Such risks require close attention of financial institutions and supervisors, not least since cyber and digital risks are not contained by jurisdictional borders.
These developments are reflected in RAQ responses, which indicate cyber risks and data security as the highest of the operational risks (ca. 80% agreement). Risk of ICT failures as a related risk remains high as well. Fraud risk has grown strongly and continues to be the second most significant contributor to operational risk, with a 55% consensus, and on a rising trend. Conduct and legal risks are identified as the third most significant contributors to operational risk, with a 44% consensus, and on broadly steady trend (Figure 48). While digitalisation and technological advances, including cyber risk, are the key drivers of operational risk, financial institutions and supervisors are also closely monitoring outsourcing risk, the risk of financial crime, including ML risk, and further conduct-related and legal risks to which they are exposed.
*Agreement to up to three options was possible for respondents.
Operational risk losses affect banks concerned
Operational risk events may not only cause direct financial losses but might also imply reputational damage. This may result in decreasing revenues if e.g. a bank exits certain business areas or faces challenges to retain or attract customers. Costs might, moreover, indirectly increase because of materialising operational risk, when higher investments in compliance, governance, and technology, become necessary. Country-by-country data on new operational risk losses in 2024 shows that losses are widely dispersed. While in six countries operational risk losses were at about 1% of CET1 capital or above, several jurisdictions reported relatively low loss amounts of less than 0.1% of CET1 capital (Figure 49).
Technology impacts increasing fraud risk
The relevance of fraud risk as a key driver of operational risk continues to grow further in the last two iterations of the RAQ. Fraud risk is considered the second most relevant contributor to operational risk, at 55% agreement, and ahead of conduct and legal risks (44% agreement), and continues to trend upwards. Risks related to digitalisation and innovation, but also to increasing use of artificial intelligence (AI), have contributed to a continuously growing risk of fraud and financial crime. An increase in fraud could pose a significant threat to financial stability as it can undermine public trust in financial institutions and the integrity of the financial system. When consumers lose confidence in the security and reliability of financial services, they may withdraw funds, limit participation in formal markets, or shift to unregulated channels. Such behavioural responses could lead to heightened liquidity pressures and weaken credit intermediation. Persistent concerns about institutional resilience to fraud can also elevate systemic risk and increase the cost of capital. Strengthening fraud prevention and detection is therefore essential to preserving confidence and maintaining financial stability.
Theft or breach of customer credentials and social engineering have been identified as main drivers of increased fraud risk, followed by online and cyber-fraudulent activities and payment fraud. Growing usage of AI in financial crime is additionally facilitating technology-driven fraudulent activities. The EBA has identified that criminals are increasingly using AI to e.g. automate laundering schemes, forge documents, generate deepfakes to impersonate individuals and evade detection[34]. While AI is a driver of innovation and offers various benefits, financial institutions face challenges to keep pace with the sophisticated threats that AI tools may enable. This highlights that the need for responsible AI use and robust monitoring remains important[35].
Conduct and legal risk resulting in high redress payments persists
Conduct and legal risks are identified as the third most significant contributors to operational risk, with a 44% consensus. Over recent years, these risks have already been a major driver of operational risk for banks, evidenced by high levels of legal and redress payments that financial institutions had to render. Underlining the continued high relevance and financial impact of materialising conduct and legal risk for banks concerned, the share of banks having paid out in the last three years over 2% of their equity in in the form of litigation, compensation, redress or similar payments has increased to 12% in the RAQ, from 9% in the last iteration. The increase was strongest for banks having paid out large amounts of over 4% of their equity and indicates that high volumes of legal and redress payments persist.
Dependencies on third-party providers pose risks
Outsourcing risks has increased considerably in banks’ perceptions, according to the RAQ. Reliance on outsourcing business activities and data has grown and is often provided by third party service providers domiciled in third countries outside the EU. A high dependency on such service providers, for example cloud service providers, and other financial service providers, such as payment services, may have contributed to increased outsourcing risk perceptions. Important services are often outsourced to few large service providers only, with increased reliance of the banking system on these providers and potential systemic implications. Anecdotal evidence for instance also suggests that related to cyber risks contagion channels and weak links are often not least related to the outsourcing company[36].
Reporting of AML/CFT weaknesses through EuReCA
From 1 October 2024 to 30 September 2025, 36 national competent authorities and the ECB reported to EuReCA, the EU’s central database for AML/CFT, 833 serious deficiencies, or ‘material weaknesses’, that they had detected in credit and financial institutions exposing them to ML/TF risks[37]. Most reports concerned credit institutions, followed by an increase in deficiencies detected in E-money institutions and payment institutions. Most material weakness reported during this 12-month period were related to customer due diligence (CDD) failures, followed by deficiencies in institutions’ wider AML/CFT system and controls and suspicious transaction reporting. The most common measures in response to material weaknesses reported by competent authorities were orders to correct the deficiencies, followed by orders to implement measures and by fines (Figure 50).
Figure 50: Financial crime risks, October 2024 to September 2025

Source: European reporting system for material CFT/AML weaknesses (EuReCa)
Digitalisation and ICT-related risks
Cyber- and ICT-related risk as well as data security are by far the most prominent driver of operational risk for banks as the digital transformation advances. According to ENISA, the financial sector continues to be among most targeted sectors of cyber-attacks in the EU in 2025[38]. Distributed denial of service (DDoS) attacks were identified as the dominant incident type and accounted for 77% of reported incidents in 2025. The greater part of DDoS attacks were deployed by hacktivists, while cybercriminal operators[39] represent only a minor portion. Ransomware is identified as the most impactful threat in the EU. The role of AI in cyberattacks has grown and has become a key trend of the rapidly evolving threat landscape. Cybercriminals increasingly use AI to optimise their malicious activities and make them more effective. Threat actors use Large Language Models to enhance phishing and automate social engineering activities. Looking forward, developments in quantum computing might add additional risks, as it might facilitate password hacks and exploit vulnerabilities in ICT systems. This includes the risks from ‘store now decrypt later’ (SNDL) actions from attackers[40].
The Digital Operational Resilience Act (DORA) came into effect in January 2025 aiming to enhance and harmonise operational resilience requirements for financial entities. DORA also requires an effective management of ICT related incidents, including their classification, management, and dissemination. Supervisors report major ICT-incidents received by financial entities to European Supervisory Authorities (ESAs), which assess them and then share them with authorities of other Member States in case the incident has a cross-border impact.
Information collected on ICT-incidents also allows the ESAs as well as participating competent authorities to assess the possibility to activate the EU systemic cyber incident coordination framework (EU-SCICF), with the purpose of ensuring suitable coordination and communication among authorities and an effective EU-level response in case of a systemic cyber incident.
The volume of incidents driven by cyberattacks may indicate some levelling
While the overall number of cyber incidents on financial institutions remains high, the share of banks that had not been victim of at least one cyberattack in the second half of 2025 has increased for the first time in the last three years. In their RAQ responses, close to 50% of banks had not been victim of a cyberattack that resulted or could have potentially resulted in a ‘major ICT-related incident’, compared to 42% in the spring 2025. Also, the share of banks that were more significantly affected by cyber incidents and had fallen victim of at least 11 cyberattacks had decreased from 10% to 7% (Figure 51). RAQ responses also suggest that, amid a decreasing volume and frequency of cyber-attacks, the share of responding banks having faced at least one successful attack which resulted in an actual major ICT-related incident decreased to 28%, from 35% in the last iteration of the RAQ, and after a steady increase since 2023. These figures might indicate that cyber threats may have levelled, albeit staying overall high.

Source: EBA Risk Assessment Questionnaire
*This relates to an ICT-related incident with a potentially high adverse impact on the network and information systems that support critical functions of the financial entity (Article 3(8) of DORA).
On the types of major ICT related incidents, the largest share of RAQ respondents experienced system ‘failure/malfunction’, followed by ‘external event’ and ‘malicious action’ in the second half of 2025. RAQ respondents also indicate that DDoS attacks were the technique most commonly applied by thread actors for successful cyber-attacks which resulted in major ICT-related incidents.
Background on geopolitical developments and the EBA’s role
Intensifying competition between major powers, ongoing conflicts, and the erosion of the international rules-based order have led to a shift towards protectionism, reshoring, and economic nationalism. The rise of nationalism and populism is increasingly influencing public opinion and policy choices, further undermining multilateral cooperation. At the same time, rapid technological change is redefining strategic rivalries and access to critical resources such as energy and rare metals have further strengthened geopolitical tensions. These developments are not only altering trade and technological flows, but they are also challenging the foundational assumptions of open markets and global financial integration.
The old paradigm of risk management operated on a foundational assumption: a stable, rules-based international system where business could operate within predictable and investible frameworks. However, this does not apply anymore: geopolitical and geoeconomic developments have become a new parameter in economics and major concern for businesses, as such also affecting banks[41]. The rise of geopolitical risks is reflected in the Geopolitical Risk (GPR) index, which has surged by approximately 30% from 2020 to 2024 (Figure 52). However, the level of the GPR index is still far from levels of 2001 (Iraq war) or 1991 (Gulf war), whereas economic and trade policy uncertainty are reaching unprecedented levels far from any previous record (Figure 56). The reaction of bank stock prices to recent tariff announcements provides evidence that such events can be relevant for the EU banking sector (see Box 4).
|

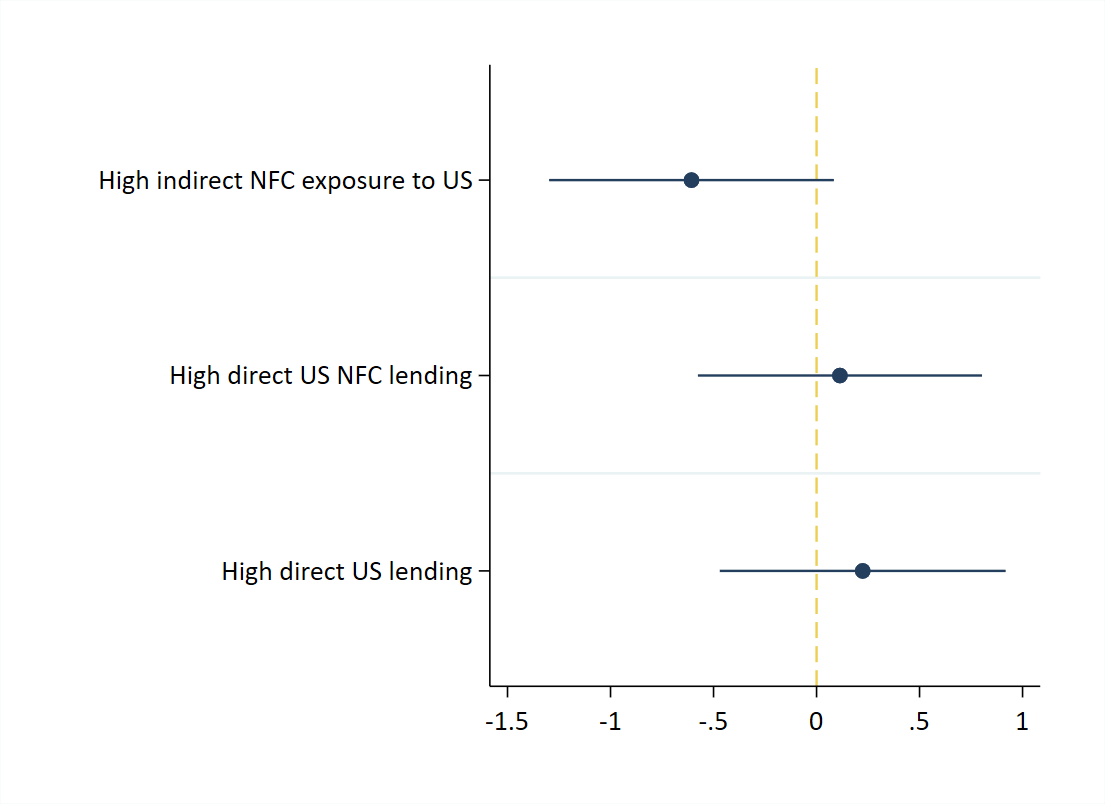
In light of heightened geopolitical tensions and economic volatility, the EBA has a role to further enhance crisis preparedness across the EU/EEA banking sector. Through its risk assessment framework, the EBA supports both market participants and supervisors in identifying and mitigating the transmission channels of geopolitical and geoeconomic risks and in promoting a forward-looking approach that strengthens financial stability and informs supervisory responses. This chapter aims to provide an overview of the implications of geopolitical and geoeconomic factors on the EU banking sector and analyse the potential impact of these implications[43].
Relevance of geopolitical and geoeconomic factors for the EU banking sector
EU/EEA banks are nowadays more used than in the past to navigate an uncertain, fragmented and volatile environment, where credit, market, liquidity or operational risks, such as those related to trapped assets or exposures to politically motivated economic and financial shocks, are the norm. So far, banks seemed to have addressed the challenges from geopolitical shocks, thanks, for instance, to their diversified portfolios and available headroom above capital requirements, which was further evidenced by the EBA stress test results this year (see Chapter on capital). However, EU/EEA banks keep facing multi-faceted and immediate threats from geoeconomic confrontation and their possible repercussions.

Source: EBA Risk Assessment Questionnaire and EBA calculations
According to EBA’s RAQ results, among the spectrum of geopolitical and geoeconomic risk related factors impacting the EU/EEA banking sector, cyber and technology-related threats stand out as the most concerning one (Figure 55). This category encompasses a wide array of sources of risks: from cyber espionage, sabotage, ransomware and DDoS (including extortionary DDoS) attacks or disinformation campaigns. Those sources of risks have the potential to be further enhanced by the implications of two technological domains (AI and DLT), with both having recently emerged as focal points in geoeconomic confrontations. These dynamics can pose significant operational risks, including service disruptions and restricted access to core infrastructure. Additionally, reputational risks play an increasingly relevant role, due to implications of client data breaches or prolonged service outages.
Restrictions on access to financial infrastructure – such as payment systems, ICT resources, and key service providers such as SWIFT – represent the second most relevant risk factor related to geopolitical and geoeconomic developments. These constraints not only affect banks directly but also expose them to second-order risks via their counterparties. The implications range from liquidity stress to operational disruption, particularly when access to critical infrastructure is curtailed due to geopolitical tensions.
Trade-related geoeconomic instruments, including tariffs, blockades, and intensified customs checks, can also carry risks. Sudden shifts in trade policy can trigger market volatility, margin calls, and pricing shocks, thereby elevating market risk including counterparty credit risk. Credit risk as such may also rise, as tariffs negatively impact directly and indirectly several sectors, disrupting trade flows[44]. Moreover, the need to enhance security amidst rising geopolitical tensions requires a substantial investment on behalf of sovereigns. However, countries, especially those highly indebted, may be challenged by limited fiscal capacity. Sovereign debt-related measures, such as repayment standstills, sanctions on government debt, or defaults can thus rapidly erode market confidence and trigger repricing events. A potential resurgence of the sovereign-bank nexus could amplify such risks, in line with EU banks’ level of concern in responses to the EBA’s RAQ.
Other factors such as export controls, exchange rate volatility or manipulation, economic sanctions on high-risk third-country jurisdictions or companies and investment restrictions (e.g. FDI or outbound investment screening) can also have implications for the EU/EEA banking sector. However, banks appear to be less concerned with their implications, not least due to their longstanding experience in managing and mitigating these kinds of risks.
Implications of geopolitical and geoeconomic factors for EU/EEA banks
Geoeconomic risks can have broad implications for credit supply and the stability of the banking sector. RAQ results show that macroeconomic and trade policy uncertainty is among the most concerning implications of geoeconomic factors for EU/EEA banks. Current outstanding levels of uncertainty (Figure 56), comparatively more prominent that geopolitical risk (Figure 52), can have broad implications for banks, such as the indirect effects on banks’ stock prices or contractions in lending, particularly regarding banks with borrowers heavily exposed to global trade flows. Banks may also adjust their lending strategies to avoid enforcement risks due to potential targeted sanctions, as seen in the differentiated responses of EU/EEA banks to sanctioned countries, depending on the jurisdiction of their subsidiaries and branches. Among rising geopolitical uncertainty, banks might aim to reduce cross-border lending or lending to certain sectors, while simultaneously increasing exposure to sectors linked to military or defence-related businesses or projects.
Figure 56a: Top 5 implications of geoeconomics for EU/EEA banks (average score, with 1 – low impact and 5 – high impact) 
The EBA RAQ results also show that banks appear to be concerned about potential implications of geoeconomic factors on asset quality or in an increase of credit risk that affect provisioning, including overlays. However, despite the elevated geopolitical uncertainty, macroeconomic conditions have proven more resilient than expected, and the EBA has not yet observed a material deterioration in asset quality. This has led to a cautious approach where banks appear to have applied managerial overlays, based on expert judgment, to account for potential downside risks. These overlays appear to be calibrated to reflect, for instance, sectoral vulnerabilities, particularly in industries exposed to geopolitical disruptions or sensitive to tariff increases, or potentially negative rating decisions, when these are linked to geopolitical or geoeconomic factors. However, the absence of a direct and observable impact on default rates has limited the extent of provisioning changes, reinforcing the view that geoeconomic risks appear to be more strategic and long-term than immediate and quantifiable (on asset quality developments and trends see also Chapter on Asset quality trends).
Quantitative and qualitative approaches to geopolitical and geoeconomic risks
Despite the sophistication of quantitative methods extensively used by financial institutions across the EU/EEA to identify and assess geopolitical and geoeconomic risks (see below Box 5), the EBA’s market intelligence found that quantitative indicators face critical limitations. Most are inherently backward-looking, reflecting the aftermath of geopolitical events rather than providing insights into future scenarios or potential bank-specific forecasts, as they might materialise in developments with limited prior foresight or anticipation. Some are also focused on data from US or anglosphere sources. Incorporating qualitative assessments (based on expert judgement) to existing approaches (e.g. scenario analysis or strategic foresight assessments, remain indispensable for understanding the motivations, trajectories, and potential spillovers of geopolitical developments, and ultimately their impact on banks). As such, while quantitative tools offer valuable inputs, they should be seen as complementary to, rather than substitutes for, qualitative analysis in banks’ risk frameworks.
Among qualitative methods to manage geopolitical and geoeconomic risks, scenario planning has emerged as the most widely adopted approach by EU/EEA banks according to the EBA’s RAQ (Figure 57). Additional anecdotal evidence suggests that this also reflects a strategic shift in recent years, as banks integrate geopolitical scenarios – such as energy price shocks or regional conflicts – into stress testing frameworks. Larger institutions, particularly cross-border universal banks, are leading this evolution, often supported by dedicated geopolitical risk committees and scenario working groups. These entities coordinate inputs from other teams such as finance, strategy, and research teams to assess the probability and impact of adverse geopolitical developments. Enhanced due diligence and crisis management playbooks also feature prominently, especially among smaller banks, which rely on these tools to navigate complex environments with limited resources.
RAQ results also show – supported by anecdotal evidence – that regional aspects and business models shape how banks perceive and respond to geopolitical threats[45]. Universal banks with cross-border operations are particularly accustomed to geopolitical risk management, given their exposure to jurisdictions with varying governance standards and regulatory environments. These banks often engage local experts and maintain strong connections with peers on the ground to enhance their risk identification capabilities. Large banks not only rely heavily on scenario planning but also report using other measures such as internal modelling, country risk watchlists and cross-sectoral analyses. In contrast, smaller banks prioritise due diligence, often lacking the scale to implement more complex risk mitigation strategies. Finally, Western and Southern European banks, in particular, tend to place greater emphasis on investment diversification, reflecting for instance their in general broader international exposure.
|
Retail risk indicator
Article 9(1) of Regulation (EU) No 1093/2010 requires the EBA to develop retail risk indicators (RRIs) for the timely identification of potential consumer harm. For this purpose, the EBA is publishing a list of 11 RRIs (Figure 58) that covers different types of products in the EBA’s consumer protection remit (e.g. mortgage credit, consumer credit and payment accounts)[50]. The indicators aim to facilitate the monitoring of the banking market in the EU/EEA, by measuring the risk of detriment arising to consumers from the misconduct of financial institutions, and from wider economic conditions.
They provide information that helps the EBA and national competent authorities to identify issues and prioritise their regulatory and supervisory work in the area of consumer protection, with a view to mitigate those issues. An explanation of the methodology for the calculation of the RRIs, including related data limitations, can be found on the EBA’s website[51]. The EBA published the RRIs for the first time in 2022 and updates them annually, which will allow the presentation of helpful time series and trends over time.
Figure 58: EBA Retail Risk Indicators
Product category | Name of indicator | Indicator number | Value – EU/EEA average | Reference period |
| I. Mortgage credit | Share of household loans with forbearance measures over total household loans | MC1 | ↓ 1.2% (1.4%) | 30/06/2025 (30/06/2024) |
| Share of NPLs collateralised by immovable property over total loans collateralised by immovable property | MC2 | ↓ 1.3% (1.5%) | 30/06/2025 (30/06/2024) | |
| II. Other consumer loans | Share of NPLs from credit for consumption over total credit for consumption | OCL1 | = 5.3% (5.3%) | 30/06/2025 (30/06/2024) |
| III. Payment and deposit accounts | Percentage of deposit interest expenses paid by banks to households over total household deposits | PDA1 | ↓ 1.4% (1.6%) | 30/06/2025 (30/06/2024) |
| IV. Credit & debit cards | Share of fraudulent card payments over total card payments (in terms of volume and value of total transactions) | CDC1 | 0.02% | 2024 |
0.03% | 2024 | |||
| Change to previous year of the fraud losses borne by card payment users | CDC2 | 12% | Difference between 2023 and 2024 | |
| V. Other payment instruments | Share of fraudulent credit transfer payments over total transfer payments (in terms of volume and value of total transactions) | OPI1 | 0.001% | 2024 |
0.002% | 2024 | |||
| Change to previous year of the fraud losses borne by consumers (credit transfers) | OPI2 | 11% | Difference between 2023 and 2024 | |
| VI. Access to financial services | The percentage of people aged 15+ who have an account at a bank or another type of financial institution | AFS1 | ↓ 94% (96%) | 2024 (2021) |
| The percentage of respondents aged 15+ who report having a debit or credit card | AFS2 | ↑ 90% (87%) | 2024 (2021) | |
| The percentage of respondents aged 15+ who report borrowing any money from family, relatives, or friends in the past year | AFS3 | = 15% (15%) | 2021 (2017) |
Mortgage credit and other consumer loans
For mortgage credit and consumer loans, the EBA’s RRIs capture the risks to consumers by measuring consumers’ ability to repay their loans. Overall, as will be explained in more below above, the relevant indicators point to improvements in consumers’ ability to repay loans, especially in Member States with high proportion of relevant loans. However, the data should be interpreted cautiously and seen in the wider context of the economic situation in a given Member State and the EU/EEA (see also Chapter on macro-economic developments).
More specifically, the share of loans with forbearance measures aims at assessing the access of consumers to forbearance measures. In general, a decrease of this ratio may indicate the overall strength of the economy and fewer customers requiring forbearance measures, or transitioning from a period in which higher levels of forbearance measures were needed to one in which fewer measures are necessary. However, it may also indicate that consumers experience detriment because their access to forbearance measures is lower over time. Between June 2024 and June 2025, the share of household loans with forbearance measures over total household loans decreased from 1.4% to 1.2% across the EU/EEA which follows the trend from the previous year (Figure 59). The fall was significant in Member States with comparatively high level of such loans – Greece, Cyprus, and Hungary, as well as Denmark, Germany and Luxembourg where the fall is significant but from a low level. The proportion of such loans increased only in France, Iceland, Lithuania and Sweden, but not significantly, and from a relatively low level, especially in the case of Lithuania and Sweden.
The share of non-performing loans collateralised by residential immovable property aims at measuring whether consumers face difficulties to make their mortgage payments. In general, a decrease of this ratio indicates that consumers’ financial situation is improving. However, it may also be the case that over time the indicator could for instance decrease if banks change their business model and/or limit providing mortgage products to certain consumers, and/or dispose of such loans. Between June 2024 and June 2025, the share of NPLs collateralised by immovable properties over all such loans decreased from 1.5% to 1.3% across the EU/EEA (Figure 60). Among the Member States where the ratio decreased, the most significant falls were observed in Member States with a high proportion of NPLs, such as Cyprus and Hungary, and to a lesser extent in Greece, as well as Bulgaria, Estonia and Norway where the figures decreased from a lower base. The only countries where the proportion of such loans increased noticeably were those where the proportion of NPLs was very low in the previous year, like in Iceland.
The share of NPLs from credit for consumption remained largely stable between June 2024 to June 2025 at 5.3% (Figure 61). The proportion of such NPLs decreased the most in Norway, Denmark, Lithuania and Poland while increasing the most in Luxembourg, albeit from one of the lowest levels in the EU/EEA.[52]

Source: EBA supervisory reporting data
Payment and deposit accounts
For payment and deposit accounts, the EBA’s RRIs capture the risks to consumers by measuring the profitability of holding deposits. The percentage of deposit interest expenses paid by banks to households over total household deposits measures the costs of holding deposits for banks, and in turn, the benefit to consumers. In general, a decrease of this ratio would mean that ceteris paribus holding deposits is less profitable for consumers. On the other hand, an increase would mean that ceteris paribus consumers are benefiting more from holding their deposits at a bank. Between June 2024 and June 2025, the ratio decreased from 1.6% to 1.4% indicating that deposits have become less profitable for consumers (Figure 62). In line with for instance a decline in central bank rates (see for instance also Chapter on these developments). The decrease was noticeable in most Member States, and particularly so in Sweden, Denmark and Luxembourg, while the figures have increased in eight Member States – Iceland, Norway, Hungary, Ireland, Lithuania, Slovakia, Croatia and Cyprus.
Payment services
For payment services, some of the risks to consumers are captured by measuring the ratio of fraudulent payments in general and the losses borne by consumers as a result of fraud in particular[53]. With regard to the former, the share of fraudulent card payments aims at measuring the share of fraudulent transactions in the total volume and value of card payments. An increase of this ratio would indicate that consumers are more exposed to fraud in the context of their card payments. In 2024, 0.015% of the volume of card payments in the EU/EEA were fraudulent and ranged from 0.03% in France to close to zero in Estonia, Latvia, Poland and Romania (Figure 63). The value of fraudulent card payments compared to the total value of card payments was 0.033% in the EU/EEA. In two Member States – France and Hungary – the value of fraudulent payments exceeded 0.05%.
Another indicator is the share of fraudulent credit transfer transactions in the total volume of such payments. An increase of this ratio may indicate that consumers are more exposed to fraud in the context of their use of credit transfers. In 2024, 0.002% of credit transfers in the EU/EEA were fraudulent and the proportion ranged from 0.015% in Lithuania and 0.009% in Malta, to close to zero in Liechtenstein, Iceland, Bulgaria, Cyprus and Greece (Figure 64). The value of fraudulent credit transfers as a proportion of the value of all such transfers was 0.001% in the EU/EEA in 2024 with highest share of fraudulent transfers in Slovenia and Lithuania, and lowest figures in the Netherlands and Liechtenstein. Putting these two figures together, it becomes clear that in most Member States high volume is accompanied by high value – e.g. in Lithuania and Malta – and vice versa, and only in some Member States one of the figures is relatively high while the other is low – as is the case for example in Austria, Ireland, Italy and the Netherlands.
Furthermore, changes to the volume of losses due to fraud that are borne by card payment services users are also monitored. From 2023 to 2024, the total value of losses from this type of payment increased by 12% in the sample of 27 EEA countries for which the EBA has data, reversing the decrease of 12% from the year before (Figure 65). The increase from 2023 to 2024 was mainly driven by increase of fraud losses in France which has the highest losses in absolute terms. Disregarding France, the results show that for the remaining 26 EEA countries the increase was on average 4%. Even though the total value of losses across the EU from this type of payment increased by 12%, the total value of losses due to fraud borne by card payment services users decreased in 13 of the 27 EEA countries between 2023 and 2024. The greatest percentage increase occurred in Malta, Iceland, and Finland, while the greatest percentage reduction took place the Netherlands, Cyprus and Greece. However, the quality of the data underlying this particular indicator requires further improvements to arrive at robust conclusions and, thus, results should be interpreted carefully.
Turning from credit card payments to credit transfers, the EBA RRI shows an 11% increase during the past year in the value of losses due to fraud that are borne by the users, which is the same increase as the year before (Figure 66). The results seem to be driven mainly by significant increase in losses in Member States where the overall level of losses is high, such as France, Germany and Norway. Between 2023 and 2024, the total value of losses due to fraud borne by users of credit transfers increased in 21 of the 28 EEA countries for which the EBA has data for both years. The greatest percentage increase occurred in Liechtenstein and Lithuania, while the greatest percentage reduction took place in the Netherlands and Malta. However, akin to the caveat for Figure 65 above, the quality of the data underlying this particular indicator requires further improvements to arrive at robust conclusions and, thus, results should be interpreted carefully.
Access to financial services
Concerning access to financial services, the EBA RRIs include three indicators based on World Bank survey data – the percentage of people aged 15+ who have an account at a bank or another type of financial institution, those who report having a debit or credit card, and those who report borrowing any money from family, relatives or friends in the past year. As the Word Bank updates these particular indicators only every 3-4 years, but the EBA publishes its RRIs on an annual basis, these RRIs remain unchanged for several years. One indicator shows the percentage of people aged 15+ who report having an account at a bank or another type of financial institution or report personally using mobile money services in the past year. The higher the figure the higher the proportion of the adult population with access to the most basic financial service. The latest data available is for 2024 and shows that on average in the EU/EEA 94% of people had a bank account (Figure 67a). While in more than half of EU/EEA states the figure is close to 100%, in Romania, Bulgaria, Italy, Poland, Greece and Hungary it is below 90%.
Another indicator is the percentage of people aged 15+ who report having a debit or a credit card. The higher the figure the higher the proportion of the adult population with access to such payment services. In 2024, on average 90% of people aged 15+ had a debit or credit card in EU/EEA Member States, with close to 100% in many states in the north of the EU/EEA, and figures below 70% only in Romania (Figure 67b). Finally, the percentage of people aged 15+ who report borrowing any money from family, relatives or friends in the past year is another RRI considered here. A higher figure may indicate that fewer people have access to loans from financial institutions, and thus, resort to borrowing from family, relatives or friends. A higher figure may also indicate that the costs of borrowing have increased, making it less affordable to use financial services. In 2021, on average 15% of people have borrowed money from family, relatives or friends across the EU/EEA, with more than 25% in Bulgaria, Greece and Romania, and less than 10% in Portugal and Italy (Figure 68).
Considerations on mitigating measures to address key risks and vulnerabilities for the EU/EEA banking sector
The EU/EEA faces major challenges against macroeconomic and geopolitical uncertainty, and at the same time the need to ensure its competitiveness globally. Banks play a major role in addressing these challenges. This includes the need to provide adequate lending to productive sectors of the economy to help Europe to remain competitive, that innovation can thrive, that decarbonisation is addressed and that Europe’s defence can be enhanced. It remains an important task for the EU/EEA banking sector to support the transition of the economy towards more sustainability and to mitigate risks stemming from climate change and broader ESG factors. Banks have already actively facilitated and supported investments in energy, utilities, technology and defence and they should continue to do so using prudent loan origination policies.
Sovereign spending is on a rising trend not least amid geopolitical, but also socio-economic and other challenges and spending needs. Rising sovereign debt might raise renewed concerns about debt sustainability. It will be important that banks ensure cautious management of their sovereign exposures. This does not only concern banks’ assets but is for instance also related to their LCR management. Banks with increased sovereign exposures not only face related credit and market risks but also heightened sensitivity to political and fiscal dynamics.
Amid the uncertain, fragmented and volatile geopolitical environment, EU/EEA banks should continue considering related emerging risks in their risk management frameworks. While for instance country risk frameworks and regulatory capital buffers have offered resilience against past shocks, current threats from geopolitical and geoeconomic confrontation as well as from operational risk demand continued vigilance and updated scenarios, which consider such circumstances. This includes operational and organisational planning for worst-case scenarios in respect of geopolitical developments, but for instance also ensuring an explicit integration of geopolitical risks in banks’ internal stress test scenarios.
To address geopolitical and geoeconomic risks banks should integrate qualitative assessments, such as expert judgement and strategic foresight, into their risk frameworks. This is to complement quantitative indicators, which face limitations despite their increasing sophistication. To mitigate exposures to politically motivated financial and operational disruptions and trapped assets, banks could enhance their internal intelligence and geopolitical risk capabilities and embed geopolitical scenario planning into strategic decision-making. They can for instance conduct enhanced due diligence and scenario analysis given their sensitivity to policy changes, technological disruption and geopolitical risks.
Elevated geopolitical risks also affect operational risks and keep threats from the cyber and digital space high on banks’ and supervisors’ agenda. It needs to be noted that cyber-attacks are not only limited to those from state- and state-sponsored actors, but also other criminal and similar groups. Outsourced activities appear particularly vulnerable to attacks. Even though quantum computing is not yet widespread, there is a rising risk that criminal plan and prepare for its malicious usage already now. This can become a future vulnerability that banks should address already now. Overall, on operational risks, the need for robust operational resilience, vigilant risk management, and continued investment in technology and compliance remains high.
Despite macroeconomic uncertainty and geopolitical risks, EU/EEA banks have maintained strong asset quality, with NPL ratios at historic lows and coverage ratios stable. Elevated allocation of loans to Stage 2 under IFRS 9 might indicate a cautious stance in respect of asset quality management. Banks should ensure such conservative approaches, maintaining robust and conservative provisioning practices. Supervisors should encourage transparency in the classification and reporting of Stage 2 loans and promote the use of forward-looking indicators — such as scenario analysis and qualitative assessments — to capture risks that may not be immediately evident in quantitative metrics. In addition, supervisors should focus on banks’ sectoral concentration, ensuring that increased exposures to strategic sectors should not lead to excessive risk-taking, or elevated exposures to a single industry.
EU/EEA banks have increased their exposures to NBFIs, particularly those based in third countries such as the US and UK. Supervisors and banks need to ensure proper understanding, monitoring and risk management frameworks regarding these exposures. This includes proper monitoring of concentration risks of banks’ NBFI exposures and proper risk analysis of banks’ investments into NBFIs, to ensure proper risk management of the latter, for instance concerning possible maturity mismatches of their assets and liabilities.
Banks have managed well to ensure stable funding through a healthy funding mix. It remains important to ensure that they maintain this approach, for instance making use of windows of opportunities for issuing debt. Also keeping deposits as a key part of their funding mix remains important – not least for being prepared for a potential deterioration in funding and liquidity banks should ensure to have sufficient free collateral available for securitised funding means.
Banks have managed well to keep profitability at healthy levels, not least through having a properly managed revenue mix. They should maintain this approach also going forward, and at the same time ensure that costs remain under control, despite constant needs of ICT-related investment needs. M&A – when properly carried out – can contribute to improve profitability and/or keep it at healthy levels. It is important to avoid any additional limitations beyond the legal, regulatory and supervisory boundaries for EU/EEA wide banking sector M&A.
Profitability is the key contributor to healthy capitalisation. Banks need to manage their capital prudently to ensure to be in a position to address potentially major challenges going forward. Prudential capital management should also bear in mind any potential impact from the phase-in of CRR3/CRD6. At the same time sustainable payouts are important to keep investors attracted to the sector and avoid a possible rise in banks’ CoE.
[1] This RAR was prepared by and/or includes contributions from Achilleas Nicolaou, Alain Otaegui, Aleksandra Potterie, Andreas Pfeil, Angel Monzon, Christoph Kuhn, Dimitrios Mokas, Gaetano Chionsini, Georgios Karanikolas, Jorge Pinto, Kamil Liberadzki, Maria Rocamora, Mathis Meyer, Matteo Barbieri, Pauline Simon, Priscilla Gaibini, Salvatore Corvasce, Slawek Kozdras, Valentina Drigani, and Wolfgang Strohbach.
[2] With this report, the EBA discharges its responsibility to monitor and assess market developments and provides information to other EU institutions and the general public, pursuant to Regulation (EU) No 1093/2010 of the European Parliament and of the Council of 24 November 2010 establishing a European Supervisory Authority (European Banking Authority) and amended by Regulation (EU) No 1022/2013 of the European Parliament and of the Council of 22 October 2013 (O JL, 15.12.2010, p. 12, ELI: http://data.europa.eu/eli/reg/2010/1093/oj).
[3] See the EBA’s information on supervisory reporting.
[4] Data as of the reporting date 30 June 2025 if not otherwise indicated. Supervisory reporting includes, for instance, prudential reporting (common reporting – COREP), financial reporting (FINREP). It must be noted that there are, partially, certain differences between reporting samples (on the sample of reporting banks, see Annex I) and reporting requirements, such as in the level of consolidation. Starting in Q1 2025 the COREP OF/LR templates were remodelled to reflect the changes introduced by CRR3/CRD6. In Norway and Liechtenstein, the CRR3 entered into force in Q2 2025, while in Iceland its implementation was further delayed. Therefore, these countries may be missing in some charts and analysis based on these templates. On the indicators used, see the EBA’s methodological guide on EBA indicators for risk assessment and resolution.
[5] Being an unbalanced sample, the number of reporting banks per country may sometimes display certain variations between quarters, which might accordingly affect quarterly changes in absolute and relative figures and therefore changes in risk indicators for country-level aggregates must be read with caution.
[6] There might be slight differences between some of the risk indicators covered in the Q2 2025 version of the EBA Risk Dashboard and this report, as a result of data resubmissions by banks. The Annex to the Risk Dashboard also includes a description of the risk indicators covered in this report and their calculations, and further descriptions are available in the EBA’s guide to risk indicators.
[7] The EBA’s EuReCA is a central database that puts together information submitted by competent authorities on serious deficiencies in individual financial institutions’ systems and controls that expose these institutions to money laundering and terrorist financing (ML/TF) risk. Data refers to all sectors within the remit of the EBA’s anti-money laundering/countering the financing of terrorism (AML/CFT) mandate, namely: credit institutions, payment institutions, e-money institutions, bureaux de change, investment firms, fund managers, credit providers (other than credit institutions), life insurance undertakings and life insurance intermediaries, and an additional category of ‘others’. On DORA incident reporting see for instance the Joint Technical Standards on major incident reporting.
[8] The results of the RAQ are also published separately on a semi-annual basis. These published RAQ booklets (latest published version is from spring 2025) also include explanations of the questionnaire and the analysis of the RAQ responses.
[9] The figures for the banks not participating in the EU transparency exercise are disclosed in an aggregate manner and at the highest level of consolidation in the category ‘Other banks’. This is to allow users to reconcile with the EBA’s full population of EU/EEA largest institutions.
[10] See the European Commission Economic Forecast, November 2025.
[11] See the European Commission Business and Consumer surveys, September 2025.
[13] See the Green Street Commercial Property Price Index, October 2025.
[14] Calculated as Total EU debt/EU GDP. See the Eurostat Quarterly government debt time series, March 2025.
[15] See the Federal Ministry of Finance Press release, June 2025.
[16] Q3-related information here and in the following chapters is based on market intelligence and preliminary Q3 supervisory data analysis.
[17] ECB lending survey notes that demand for housing loans has increased substantially driven by general level of interest rates and housing market prospects.
[18] See the latest results of the EBA’s RAQ Autumn 2025 edition.
[19] For the purpose of this analysis Western European countries include Austria, Belgium, France, Germany, Luxembourg and the Netherlands. Eastern European countries include Bulgaria, Czechia, Hungary, Poland, Romania, Slovak Republic. Nordic European countries include Denmark, Estonia, Finland, Iceland, Ireland, Latvia, Lithuania, Norway and Sweden. Southern European countries include Croatia, Cyprus, Greece, Italy, Malta, Portugal, Slovenia and Spain.
[20] This includes all exposures (i.e. bonds and loans, to general governments, i.e. including municipalities).
[21] ECB Financial Stability Review in May 2025 warns about the risk of stretched market valuations and possible price adjustments.
[23] Government assets include in the analysis here for instance central and regional governments as well as public sector entities etc..
[24] See the ECB’s report on repo markets: Understanding the effects of a declining Eurosystem market footprint from July 2024.
[25] See the EBA’s advice on the review of the EU covered bond framework, chapter 15.6 on issuance volumes of covered bonds.
[26] See also ECB’s Financial Stability Review (May 2025).
[27] See also the ESRB’s report on Crypto-assets and decentralised finance from October 2025.
[29] For Luxembourg, data variation is explained by a change in the sample considered in June 2024 data.
[31] Portfolios/segments are differently defined in financial reporting (FINREP), which forms the basis for the analysis in Chapter 2.1, and in common prudential reporting (COREP), which forms the basis for the analysis in this chapter. These different definitions of portfolios/segments are the reason that the respective data cannot be fully reconciled with each other. Furthermore, the concept of the carrying amount of loans differs from the concept of exposure amount. The latter, for instance, also includes loan commitments. Securitisations, like significant risk transfers (SRTs) might in some cases also contribute to these differences.
[33] ‘Payment services’ shall refer to the payment services listed in Annex I of Directive (EU) 2015/2366 of the European Parliament and of the Council of 25 November 2015 on payment services in the internal market, amending Directives 2002/65/EC, 2009/110/EC and 2013/36/EU and Regulation (EU) No 1093/2010, and repealing Directive 2007/64/EC (OJ L 337, 23.12.2015, p. 35, ELI: http://data.europa.eu/eli/dir/2015/2366/oj). For the assets involved in Payment Services the starting date of the data is Q1 2022. ‘Payment services’ shall refer to the payment services listed in Annex I of Directive (EU) 2015/2366. ‘Other’ in asset management fees include the fee and commission income generated by the institution that cannot be allocated to any of the other listed items. The whole list of fees income flows includes: securities, corporate finance, fee-based advice, clearing and settlement, asset management, custody, central administrative services for collective investment, fiduciary transactions, payment services, customer resources distributed but not managed, structured finance, loan servicing activities, loan commitments given, financial guarantees given, loans granted, foreign exchange, commodities, other fee. Customer resources distributed but not managed (by type of product) comprise fee and commission income for distribution of products issued by entities outside the prudential group to its current customers.
[34] See the EBA Opinion and Report on money laundering and terrorist financing risks affecting the EU's financial sector, July 2025.
[35] The AI Act – Regulation EU 2024/1689 of the European Parliament and of the Council of 13 June 2024 laying down harmonised rules on artificial intelligence and amending Regulations (EC) No 300/2008, (EU) No 167/2013, (EU) No 168/2013, (EU) 2018/858, (EU) 2018/1139 and (EU) 2019/2144 and Directives 2014/90/EU, (EU) 2016/797 and (EU) 2020/1828 (OJ L, 2024/1689, 12.7.2024, ELI: http://data.europa.eu/eli/reg/2024/1689/oj) already identifies prohibited practices and aims promoting a safe and trustworthy AI. It provides a single set of rules for how AI systems are developed, sold, and used across the EU.
[36] To address third-party outsourcing risk, the EBA has prepared and publicly consulted draft Guidelines on the sound management of third-party risk. The Guidelines focus on third-party arrangements in relation to non-ICT related services provided by third-party service providers and their subcontractors with a particular focus on the provision of critical or important functions. In line with DORA, the Guidelines will update the previous EBA Guidelines on outsourcing, from 2019.
[37] See further explanations on the European reporting System for material CFT/AML weaknesses.
[38] See the ENISA Threat Landscape 2025, October 2025.
[39] Cybercriminals are malicious actors who use technology to carry out unlawful activities. Hacktivism is the act of computer hacking for politically or socially motivated purposes.
[40] In case of a SNDL action attackers get access to data now and will use it in future when they will have access to quantum computing capacities. On risks related to quantum computing see for instance also Europol’s Call for action: urgent plan needed to transition to post-quantum cryptography together from February 2025.
[41] This chapter distinguishes between geopolitics and geoeconomics, which reveal different mechanisms of risk transmission. Geopolitics is for the purpose of this analysis considered as a method of foreign policy analysis that interprets international political behaviour primarily through geographical variables, such as territory, borders, proximity, migration flows, natural resources, and maritime access. It assumes that states pursue national interests through military and diplomatic tools. Geoeconomics, by contrast, refers to the use of economic instruments (trade policy, investment flows, sanctions, technological standards) to advance geopolitical objectives and defend national interests. See for instance the results of the World Economic Forum’s Global Risks Perception Survey (https://www.weforum.org/stories/2025/07/chief-geopolitical-officer-business/), which points out that geoeconomic confrontation is the third most cited risk cited by business leaders as presenting a material crisis on a global scale.
[42] See a detailed analysis on exposures to the US and selected sectors in the EBA’s spring 2025 edition of the Risk Assessment Report.
[43] Besides the usage of market and similar data as well as supervisory reporting and RAQ results, parts of the analysis in this chapter are based on interviews with several selected banks, covering geopolitical risks and how banks address them. The interviews were held in September and October 2025.
[44] See the last November 2024 edition of the Risk Assessment Report, Chapter on Assets: volume and composition, in which US tariffs and their potential impact on EU/EEA banks’ exposures are covered.
[45] These RAQ results are consistent with recent research, which shows that banks relying on foreign funding seem to be less inclined to reduce foreign investments, suggesting that funding models influence strategic adjustments. According to researchers, this behaviour contrasts with responses to traditional country risks, such as macroeconomic instability or sovereign credit deterioration, highlighting the distinct nature of geoeconomic threats. See for instance the FED discussion paper on Geopolitical Risk and Global Banking from August 2025.
[46] For the purposes of the analysis in this box, expressions such as geopolitical risk (management), geopolitical shocks, geopolitical factors, etc., should be understood as capturing also the geoeconomics dimension.
[47] On region specific index, in June 2025 Bondarenko et al. (2025) have proposed a euro-area specific GPR index which addresses the limitations of the US-centric anglosphere perspective of the previously known GPR index. The euro area GPR index appears to react more strongly to regionally proximate shocks (e.g. the Russian invasion of Ukraine or the 2023 Israel-Gaza conflict) than the GPR index.
[48] There seems to be particular focus on geopolitical risks emerging from Russia, the Middle East, the US (in general and amid tariff related developments), elections in several European countries, China / Taiwan tensions, and Eastern European countries.
[49] See also Regulation (EU) 2025/532, supplementing DORA, which for instance requires banks that use ICT TPPs with subcontracting structure related to critical or important functions etc. perform geopolitical risk related assessments.
[50] The 11 indicators were selected by the EBA from an initial long list of 50 indicators, the suitability of each of which was assessed against criteria such as measurability, data availability, data accuracy, implementation cost, geographical representativeness, and actionability.
[51] See the EBA Retail Risk Indicators.
[52] For Luxembourg, data variation is explained by a change in the sample considered in June 2024 data.
[53] The figures presented here are elaborated from statistical data on fraud relating to different means of payment that, according to the provisions of Article 96 PSD2, are sent to the EBA and the ECB by the NCAs based on the fraud data reported by their respective providers of payment services (PSPs) – i.e. credit institutions, payment institutions and electronic money institutions.