List of figures

Source: Eurostat

Source: Eurostat

Sources: Refinitiv, Central Bank of Iceland, Central Bank of Romania
(*) EURIBOR (Euro Interbank Offered Rate), CIBOR (Copenhagen Interbank Offered Rate), BUBOR (Budapest Interbank Offered Rate), REIBOR (Reykjavík interbank offered rate), ROBOR (Romanian Interbank Offered Rate), STIBOR (Stockholm Interbank Offered Rate), WIBOR (Warsaw Interbank Offered Rate), NIBOR (Norwegian interbank offered rate).

Sources: Caldare and Iacoviello, Refinitiv Workspace, S&P Capital IQ, EBA supervisory data and calculations

Source: Eurostat

Source: Refinitiv

Source: Refinitiv

Source: Bloomberg

Sources: Refinitiv, Bloomberg
(*) Eurostoxx (SXXE) Index and Euro Stoxx Bank (SX7E) Index which are part of the Eurostoxx Index, to secure comparable results. Eurostoxx Banks (SX7E) Index is a capitalisation-weighted index which includes listed banks in countries that are participating in the EMU.
Figure 8: Selected European Banks Weekly changes of stock prices (%)

(*) The banks’ sample covers different European jurisdictions but with a heavier weight towards French banks, following the political events in France.

Source: Eurostat

Source: ECB

Source: EBA Supervisory Reporting data

Source: EBA supervisory reporting data

Source: EBA supervisory reporting data

Source: EBA supervisory reporting data

Source: EBA supervisory reporting data

Source: EBA Risk Assessment Questionnaire

Source: EBA supervisory reporting data

Source: EBA Supervisory Reporting data

Source: EBA Supervisory Reporting data

Source: EU-wide cross-sectoral assessment of climate-related financial risks

Source: EBA Risk Assessment Questionnaire

Source: EBA Risk Assessment Questionnaire

Source: EBA supervisory reporting data

Source: EBA Supervisory Reporting data

Source: EBA Supervisory Reporting data
(*) Data of the charts is based on all credit institutions of EUCLID. For the list please refer here Registers and other list of institutions

Source: EBA supervisory reporting data

Source: Eurostat

Source: EBA Risk Assessment Questionnaire

Source: EBA supervisory reporting data

Source: Dealogic
(*) Cut-off date for this chart was 30 September 2024.

Source: Bloomberg

Source: IHS Markit*
(*) With regard to IHS Markit in this chart and any further references to it in this report and related products, neither Markit Group Limited (‘Markit’) nor its affiliates nor any third-party data provider make(s) any warranty, express or implied, as to the accuracy, completeness or timeliness of the data contained herewith nor as to the results to be obtained by recipients of the data. Neither Markit nor its affiliates nor any data provider shall in any way be liable to any recipient of the data for any inaccuracies, errors or omissions in the Markit data, regardless of cause, or for any damages (whether direct or indirect) resulting therefrom.

Source: Dealogic, IHS Markit, EBA calculations

Source: EBA supervisory reporting data

Source: EBA supervisory reporting data

Source: EBA Risk Assessment Questionnaire

Source: EBA Risk Assessment Questionnaire

Source: MREL & TLAC reporting, reporting of MREL decisions

Source: MREL & TLAC reporting, reporting of MREL decisions

Source: MREL & TLAC reporting, reporting of MREL decisions

Source: MREL & TLAC reporting, reporting of MREL decisions

Source: MREL & TLAC reporting, reporting of MREL decisions

Source: MREL & TLAC reporting, reporting of MREL decisions

Source: MREL & TLAC reporting, reporting of MREL decisions

Source: EBA supervisory reporting data

Source: EBA Supervisory Reporting data

Source: EBA Risk Assessment Questionnaire

Source: EBA supervisory reporting data

Source: EBA Risk Assessment Questionnaire

Source: EBA Supervisory Reporting data

Source: EBA Supervisory reporting data

EBA Supervisory Reporting data

Source: EBA supervisory reporting data

Source: EBA supervisory reporting data

Source: EBA supervisory reporting data

Source: EBA supervisory reporting data

Source: EBA supervisory reporting data

Source: EBA supervisory reporting data

Source: EBA supervisory reporting data

Source: EBA supervisory reporting data

Source: EBA supervisory reporting data

Source: EBA supervisory reporting data

Source: EBA supervisory reporting data

Source: EBA supervisory reporting data

Source: EBA Risk Assessment Questionnaire

Source: EBA supervisory reporting data

Source: EBA supervisory reporting data

Source: EBA supervisory reporting data

Source: EBA supervisory reporting data
(*) The fee income component is Q2 annualised data for each of the years

Source: EBA Risk Assessment Questionnaire

Source: EBA supervisory reporting data

Source: EBA supervisory reporting data

Source: EBA supervisory reporting data

Source: EBA supervisory reporting data
(*) Data for LT skewed higher due to the sample, which include rather high-risk banks and not the biggest national lenders.

Source: EBA supervisory reporting data

Source: EBA supervisory reporting data

Source: EBA supervisory reporting data

Source: EBA Risk Assessment Questionnaire

Source: S&P Capital IQ, and EBA assumptions and calculations
(*) Completed transactions – including whole company, minority, branches and assets acquisitions and / or mergers – involving a bank in the EEA as geography. Private equity deals are included. The volume related information / data is only available for some of the transactions, for which reason the number of deals might be considered as more relevant.

Source: EBA Risk Assessment Questionnaire

Source: Federal Reserve Bank of New York and EBA supervisory reporting data, EBA calculations
(*) For the US data the Federal Reserve Bank of New York’s “Quarterly Trends for Consolidated U.S. Banking Organizations” as of Q2 2024 is used.

Source: Federal Reserve Bank of New York and EBA supervisory reporting data, EBA calculations

Source: Federal Reserve Bank of New York and EBA supervisory reporting data, EBA calculations

Source: Federal Reserve Bank of New York and EBA supervisory reporting data, EBA calculations

Source: Federal Reserve Bank of New York and EBA supervisory reporting data, EBA calculations

Source: Federal Reserve Bank of New York and EBA supervisory reporting data, EBA calculations
(*) For the US banks’ cost of risk the annualised loan loss provisions as percentage of total loans from the data the Federal Reserve Bank of New York’s US banking sector data are used.

Source: Bloomberg
(*) The Bloomberg query INDX_PX_BOOK was used for this analysis.

Source: EBA Risk Assessment Questionnaire
(*) Agreement to up to three options was possible for respondents.

Source: EBA supervisory reporting data
(*) Gross loss amount from new events and loss adjustments relating to previous reporting periods.

Source: EBA supervisory reporting data

Source: EBA Risk Assessment Questionnaire
(*) This relates to an ICT-related incident with a potentially high adverse impact on the network and information systems that support critical functions of the financial entity (Article 3(8) DORA).
Figure 70: Financial crime risks, January 2024 – August 2024
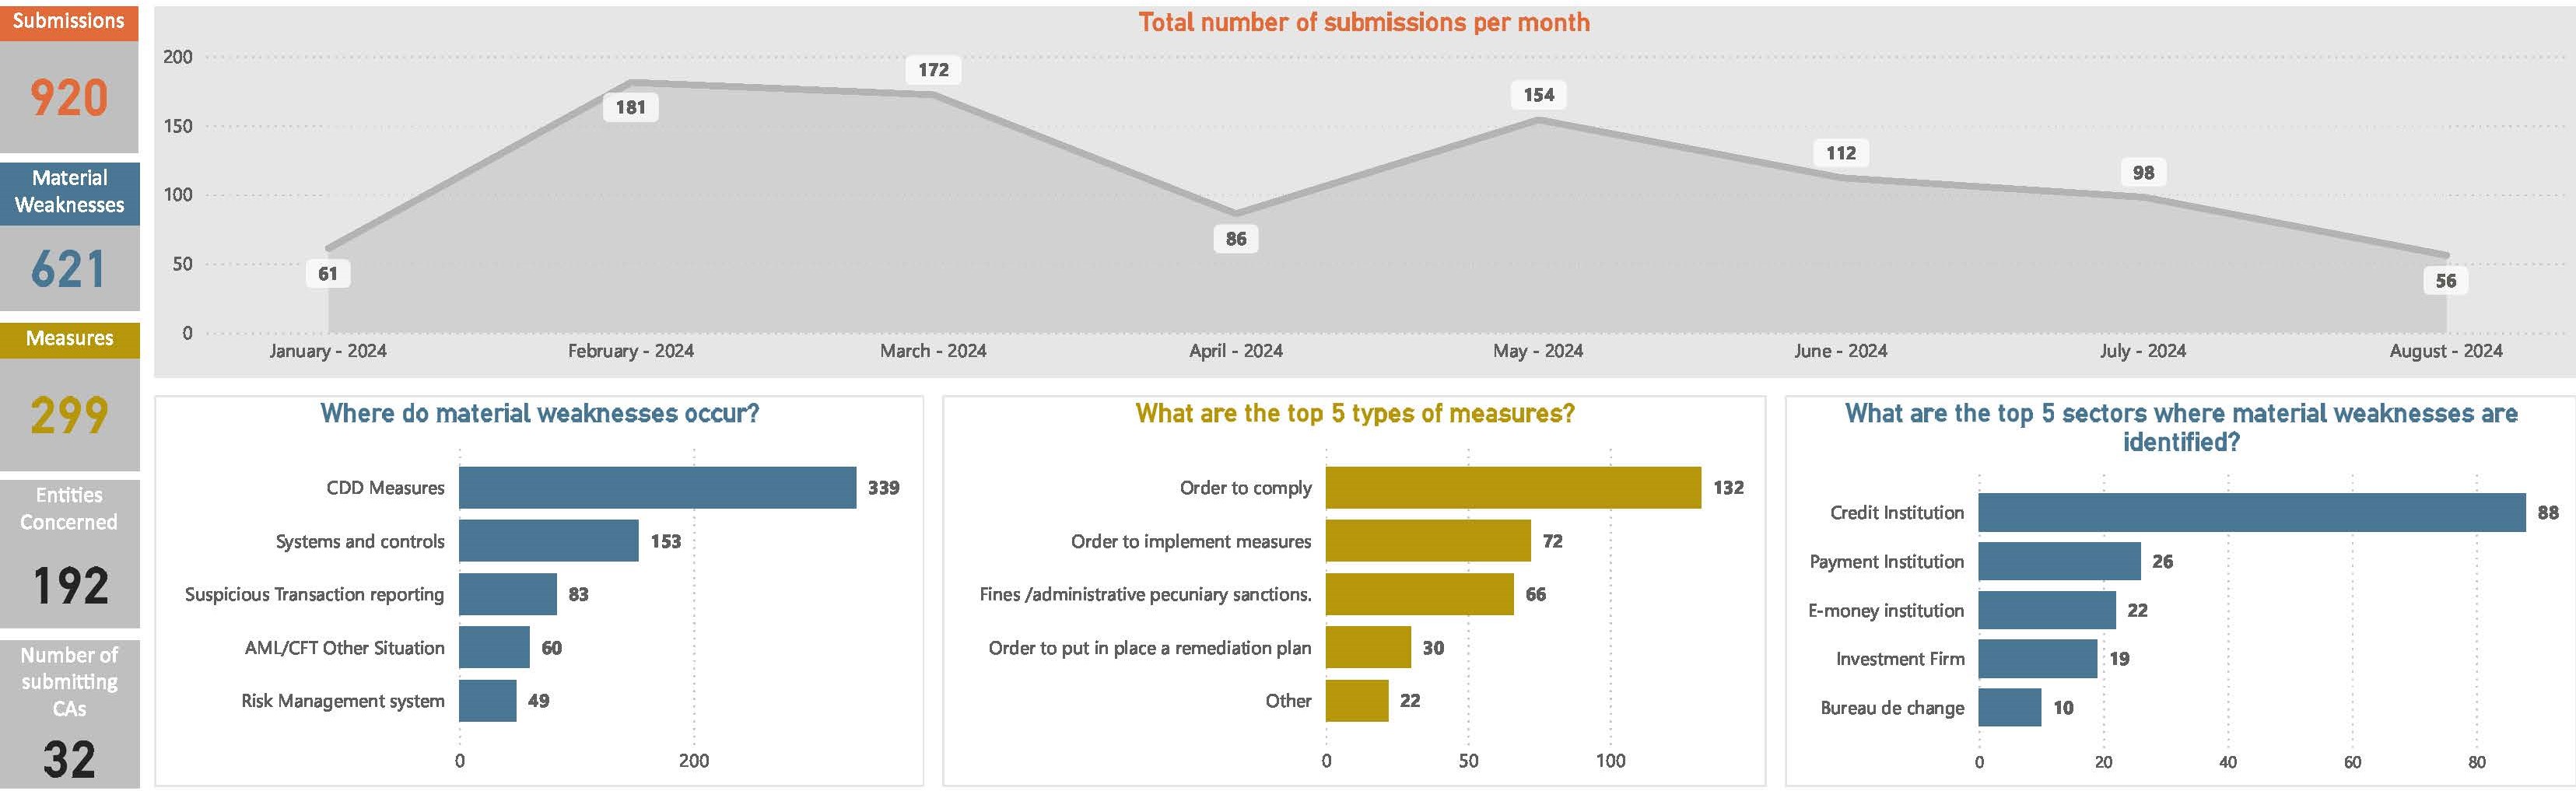

Source: EBA supervisory reporting data

Source: EBA supervisory reporting data

Source: EBA Risk Assessment Questionnaire

Source: EBA Risk Assessment Questionnaire

Source: EBA Risk Assessment Questionnaire

Source: EBA Risk Assessment Questionnaire

Source: EBA Risk Assessment Questionnaire

Source: EBA Risk Assessment Questionnaire

Source: EBA Risk Assessment Questionnaire

Source: EBA Risk Assessment Questionnaire

Source: EBA supervisory reporting data

Source: EBA supervisory reporting data

Source: EBA supervisory reporting data

Source: EBA supervisory reporting data

Source: EBA payment fraud reporting data

Source: EBA payment fraud reporting data

Source: EBA payment fraud reporting data

Source: EBA payment fraud reporting data

Source: World Bank

Source: World Bank

Source: World Bank